

TEACHER DIVERSITY
The State of Teacher Diversity_0
The State of Teacher Diversity_0
- No tags were found...

You also want an ePaper? Increase the reach of your titles
YUMPU automatically turns print PDFs into web optimized ePapers that Google loves.
Teacher and Student Diversity<br />
in Boston Public Schools<br />
1. SUMMARY OF FINDINGS<br />
Although a 1985 federal court mandated that Boston act<br />
to diversify its teaching workforce, 1 Blacks and Hispanics<br />
constituted only about 30 percent of the Boston teacher<br />
force in 2011, even though Black and Hispanic students<br />
constituted more than three-quarters of the city’s public<br />
school student body. The proportion of Black teachers in<br />
the city declined modestly between 2001 and 2011, and the<br />
Type of data<br />
Years available<br />
BOSTON DATASET<br />
District<br />
Teacher level<br />
2001–2011<br />
Charter<br />
Teacher level<br />
2007–2011<br />
population of Black teachers experienced a substantial<br />
loss. The share of White and Hispanic teachers remained<br />
relatively stable, with only slight changes in population.<br />
In both the district and charter sectors, hiring patterns<br />
served to decrease the proportion of Black teachers and increase<br />
White representation, but this was partially offset<br />
Linked b/w years<br />
Multiracial category<br />
Total sample size<br />
Yes<br />
No<br />
53,139<br />
Yes<br />
2007–2011<br />
2,552<br />
by slightly higher sector leaver rates among White teachers than Black teachers.<br />
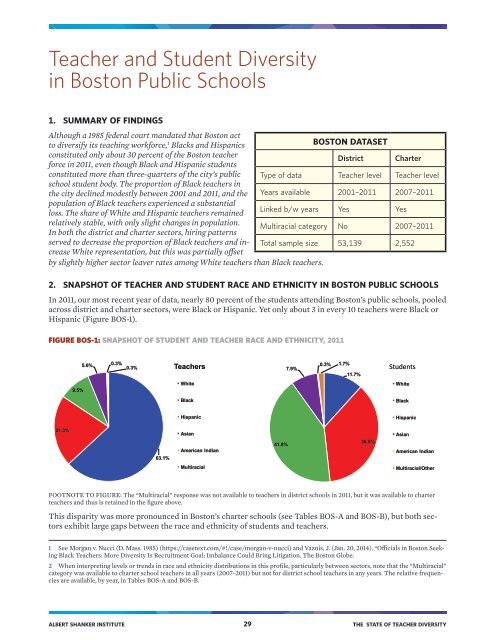
2. SNAPSHOT OF <strong>TEACHER</strong> AND STUDENT RACE AND ETHNICITY IN BOSTON PUBLIC SCHOOLS<br />
In 2011, our most recent year of data, nearly 80 percent of the students attending Boston’s public schools, pooled<br />
across district and charter sectors, were Black or Hispanic. Yet only about 3 in every 10 teachers were Black or<br />
Hispanic (Figure BOS-1).<br />
FIGURE BOS-1: SNAPSHOT OF STUDENT AND <strong>TEACHER</strong> RACE AND ETHNICITY, 2011<br />
5.6% 0.3%<br />
0.3% Teachers<br />
7.9%<br />
0.3% 1.7%<br />
11.7%<br />
Students<br />
9.5%<br />
White<br />
White<br />
Black<br />
Black<br />
Hispanic<br />
Hispanic<br />
21.3%<br />
63.1%<br />
Asian<br />
American Indian<br />
41.8%<br />
36.5%<br />
Asian<br />
American Indian<br />
Multiracial<br />
Multiracial/Other<br />
FOOTNOTE TO FIGURE: The “Multiracial” response was not available to teachers in district schools in 2011, but it was available to charter<br />
teachers and thus is retained in the figure above.<br />
This disparity was more pronounced in Boston’s charter schools (see Tables BOS-A and BOS-B), but both sectors<br />
exhibit large gaps between the race and ethnicity of students and teachers.<br />
1 See Morgan v. Nucci (D. Mass. 1985) (https://casetext.com/#!/case/morgan-v-nucci) and Vaznis, J. (Jan. 20, 2014). “Officials in Boston Seeking<br />
Black Teachers: More Diversity Is Recruitment Goal; Imbalance Could Bring Litigation. The Boston Globe.<br />
2 When interpreting levels or trends in race and ethnicity distributions in this profile, particularly between sectors, note that the “Multiracial”<br />
category was available to charter school teachers in all years (2007–2011) but not for district school teachers in any years. The relative frequencies<br />
are available, by year, in Tables BOS-A and BOS-B.<br />
ALBERT SHANKER INSTITUTE 29 THE STATE OF <strong>TEACHER</strong> <strong>DIVERSITY</strong>