

TEACHER DIVERSITY
The State of Teacher Diversity_0
The State of Teacher Diversity_0
- No tags were found...

Create successful ePaper yourself
Turn your PDF publications into a flip-book with our unique Google optimized e-Paper software.
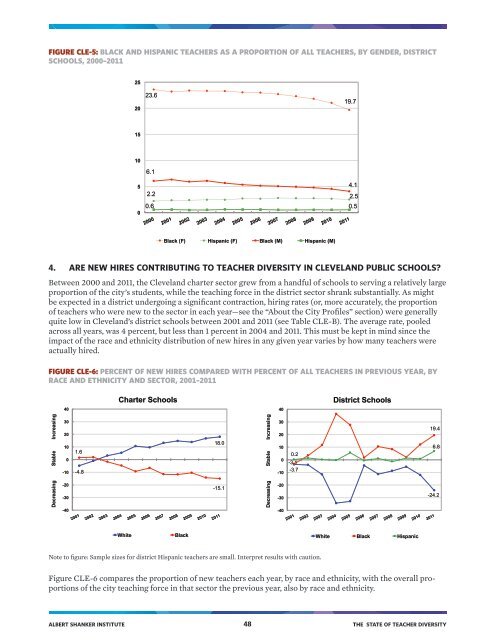
FIGURE CLE-5: BLACK AND HISPANIC <strong>TEACHER</strong>S AS A PROPORTION OF ALL <strong>TEACHER</strong>S, BY GENDER, DISTRICT<br />
SCHOOLS, 2000–2011<br />
25<br />
20<br />
23.6<br />
19.7<br />
15<br />
10<br />
5<br />
6.1<br />
4.1<br />
2.2 2.5<br />
0<br />
0.6 0.5<br />
Black (F) Hispanic (F) Black (M) Hispanic (M)<br />
4. ARE NEW HIRES CONTRIBUTING TO <strong>TEACHER</strong> <strong>DIVERSITY</strong> IN CLEVELAND PUBLIC SCHOOLS?<br />
Between 2000 and 2011, the Cleveland charter sector grew from a handful of schools to serving a relatively large<br />
proportion of the city’s students, while the teaching force in the district sector shrank substantially. As might<br />
be expected in a district undergoing a significant contraction, hiring rates (or, more accurately, the proportion<br />
of teachers who were new to the sector in each year—see the “About the City Profiles” section) were generally<br />
quite low in Cleveland’s district schools between 2001 and 2011 (see Table CLE-B). The average rate, pooled<br />
across all years, was 4 percent, but less than 1 percent in 2004 and 2011. This must be kept in mind since the<br />
impact of the race and ethnicity distribution of new hires in any given year varies by how many teachers were<br />
actually hired.<br />
FIGURE CLE-6: PERCENT OF NEW HIRES COMPARED WITH PERCENT OF ALL <strong>TEACHER</strong>S IN PREVIOUS YEAR, BY<br />
RACE AND ETHNICITY AND SECTOR, 2001–2011<br />
Charter Schools<br />
District Schools<br />
40<br />
40<br />
Decreasing Stable Increasing<br />
30<br />
20<br />
10<br />
0<br />
-10<br />
-20<br />
-30<br />
-40<br />
1.6<br />
-4.8<br />
18.0<br />
-15.1<br />
Decreasing Stable Increasing<br />
30<br />
20<br />
10<br />
0<br />
-10<br />
-20<br />
-30<br />
-40<br />
0.2<br />
-3.1<br />
-3.7<br />
19.4<br />
6.8<br />
-24.2<br />
White<br />
Black<br />
White Black Hispanic<br />
Note to figure: Sample sizes for district Hispanic teachers are small. Interpret results with caution.<br />
Figure CLE-6 compares the proportion of new teachers each year, by race and ethnicity, with the overall proportions<br />
of the city teaching force in that sector the previous year, also by race and ethnicity.<br />
ALBERT SHANKER INSTITUTE 48 THE STATE OF <strong>TEACHER</strong> <strong>DIVERSITY</strong>