

TEACHER DIVERSITY
The State of Teacher Diversity_0
The State of Teacher Diversity_0
- No tags were found...

Create successful ePaper yourself
Turn your PDF publications into a flip-book with our unique Google optimized e-Paper software.
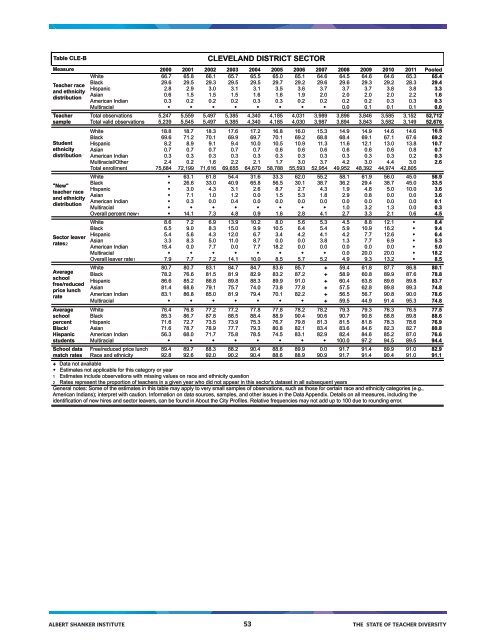
Table CLE-B<br />
Measure 2000 2001 2002 2003 2004 2005 2006 2007 2008 2009 2010 2011 Pooled<br />
White 66.7 65.8 66.1 65.7 65.5 65.0 65.1 64.6 64.5 64.6 64.6 65.3 65.4<br />
Teacher race<br />
and ethnicity<br />
distribution<br />
Teacher<br />
sample<br />
Student<br />
ethnicity<br />
distribution<br />
"New"<br />
teacher race<br />
and ethnicity<br />
distribution<br />
Sector leaver<br />
rates2<br />
Average<br />
school<br />
free/reduced<br />
price lunch<br />
rate<br />
Average<br />
school<br />
percent<br />
Black/<br />
Hispanic<br />
students<br />
School data<br />
match rates<br />
CLEVELAND DISTRICT SECTOR<br />
Black 29.6 29.5 29.3 29.5 29.5 29.7 29.2 29.6 29.6 29.3 29.2 28.3 29.4<br />
Hispanic 2.8 2.9 3.0 3.1 3.1 3.5 3.6 3.7 3.7 3.7 3.8 3.8 3.3<br />
Asian 0.6 1.5 1.5 1.5 1.6 1.6 1.9 2.0 2.0 2.0 2.0 2.2 1.6<br />
American Indian 0.3 0.2 0.2 0.2 0.3 0.3 0.2 0.2 0.2 0.2 0.3 0.3 0.3<br />
Multiracial ! ! ! ! ! ! ! ! 0.0 0.1 0.1 0.1 0.0<br />
Total observations 5,247 5,559 5,497 5,385 4,340 4,185 4,031 3,989 3,896 3,846 3,585 3,152 52,712<br />
Total valid observations 5,239 5,545 5,497 5,385 4,340 4,185 4,030 3,987 3,894 3,843 3,582 3,149 52,676<br />
White 18.8 18.7 18.3 17.6 17.2 16.8 16.0 15.3 14.9 14.9 14.6 14.6 16.5<br />
Black 69.6 71.2 70.1 69.9 69.7 70.1 69.2 68.8 68.4 69.1 67.1 67.6 69.2<br />
Hispanic 8.2 8.9 9.1 9.4 10.0 10.5 10.9 11.3 11.6 12.1 13.0 13.8 10.7<br />
Asian 0.7 0.7 0.7 0.7 0.7 0.6 0.6 0.6 0.6 0.6 0.6 0.8 0.7<br />
American Indian 0.3 0.3 0.3 0.3 0.3 0.3 0.3 0.3 0.3 0.3 0.3 0.2 0.3<br />
Multiracial/Other 2.4 0.2 1.6 2.2 2.1 1.7 3.0 3.7 4.2 3.0 4.4 3.0 2.6<br />
Total enrollment 75,684 72,199 71,616 69,655 64,670 58,788 55,593 52,954 49,952 48,392 44,974 42,805<br />
White ! 63.1 61.8 54.4 31.6 33.3 62.0 55.2 58.1 61.9 56.0 45.0 58.9<br />
Black ! 26.6 33.0 40.9 65.8 56.5 30.1 38.7 36.2 29.4 38.7 45.0 33.5<br />
Hispanic ! 3.0 4.3 3.1 2.6 8.7 2.7 4.3 1.9 4.8 5.0 10.0 3.6<br />
Asian ! 7.1 1.0 1.2 0.0 1.5 5.3 1.8 2.9 0.8 0.0 0.0 3.6<br />
American Indian ! 0.3 0.0 0.4 0.0 0.0 0.0 0.0 0.0 0.0 0.0 0.0 0.1<br />
Multiracial ! ! ! ! ! ! ! ! 1.0 3.2 1.3 0.0 0.3<br />
Overall percent new1 ! 14.1 7.3 4.8 0.9 1.6 2.8 4.1 2.7 3.3 2.1 0.6 4.5<br />
White 8.6 7.2 6.9 13.9 10.2 8.0 5.6 5.3 4.5 8.8 12.1 ! 8.4<br />
Black 6.5 9.0 8.3 15.0 9.9 10.5 6.4 5.4 5.9 10.9 16.2 ! 9.4<br />
Hispanic 5.4 5.6 4.3 12.0 6.7 3.4 4.2 4.1 4.2 7.7 12.6 ! 6.4<br />
Asian 3.3 8.3 5.0 11.0 8.7 0.0 0.0 3.8 1.3 7.7 6.9 ! 5.3<br />
American Indian 15.4 0.0 7.7 0.0 7.7 18.2 0.0 0.0 0.0 0.0 0.0 ! 5.0<br />
Multiracial ! ! ! ! ! ! ! ! 0.0 20.0 20.0 ! 18.2<br />
Overall leaver rate1 7.9 7.7 7.2 14.1 10.0 8.5 5.7 5.2 4.9 9.3 13.2 ! 8.5<br />
White 80.7 80.7 83.1 84.7 84.7 83.6 85.7 ✚ 59.4 61.8 87.7 86.8 80.1<br />
Black 78.2 76.6 81.5 81.9 82.9 83.2 87.2 ✚ 58.9 60.8 89.9 87.6 78.8<br />
Hispanic 86.6 85.2 86.8 89.8 88.3 89.9 91.0 ✚ 60.4 63.8 89.6 89.8 83.7<br />
Asian 81.4 68.6 79.1 75.7 74.0 73.8 77.8 ✚ 57.5 62.8 89.8 89.3 74.8<br />
American Indian 83.1 86.8 85.0 81.9 79.4 70.1 82.2 ✚ 56.5 56.7 90.8 90.0 78.6<br />
Multiracial ! ! ! ! ! ! ! ✚ 59.5 44.9 91.4 95.3 74.8<br />
White 76.4 76.8 77.2 77.2 77.8 77.8 78.2 78.2 79.3 79.3 76.3 76.5 77.5<br />
Black 85.3 86.7 87.8 88.5 88.4 88.9 90.4 90.6 90.7 90.8 88.8 89.8 88.6<br />
Hispanic 71.6 72.7 73.5 73.9 75.3 76.7 79.8 81.3 81.5 81.8 78.3 78.6 76.9<br />
Asian 71.6 78.7 78.9 77.7 79.3 80.8 82.1 83.4 83.6 84.6 82.3 82.7 80.8<br />
American Indian 56.3 68.0 71.7 75.8 78.5 74.5 83.1 82.9 82.4 84.6 85.2 87.0 76.6<br />
Multiracial ! ! ! ! ! ! ! ! 100.0 97.2 94.5 89.5 94.4<br />
Free/reduced price lunch 89.4 89.7 88.3 88.2 90.4 88.6 89.9 0.0 91.7 91.4 89.9 91.0 82.9<br />
Race and ethnicity 92.8 92.6 92.0 90.2 90.4 88.6 88.9 90.9 91.7 91.4 90.4 91.0 91.1<br />
✚ Data not available<br />
! Estimates not applicable for this category or year<br />
1 Estimates include observations with missing values on race and ethnicity question<br />
2 Rates represent the proportion of teachers in a given year who did not appear in this sector's dataset in all subsequent years<br />
General notes: Some of the estimates in this table may apply to very small samples of observations, such as those for certain race and ethnicity categories (e.g.,<br />
American Indians); interpret with caution. Information on data sources, samples, and other issues in the Data Appendix. Details on all measures, including the<br />
identification of new hires and sector leavers, can be found in About the City Profiles. Relative frequencies may not add up to 100 due to rounding error.<br />
ALBERT SHANKER INSTITUTE 53 THE STATE OF <strong>TEACHER</strong> <strong>DIVERSITY</strong>