

TEACHER DIVERSITY
The State of Teacher Diversity_0
The State of Teacher Diversity_0
- No tags were found...

You also want an ePaper? Increase the reach of your titles
YUMPU automatically turns print PDFs into web optimized ePapers that Google loves.
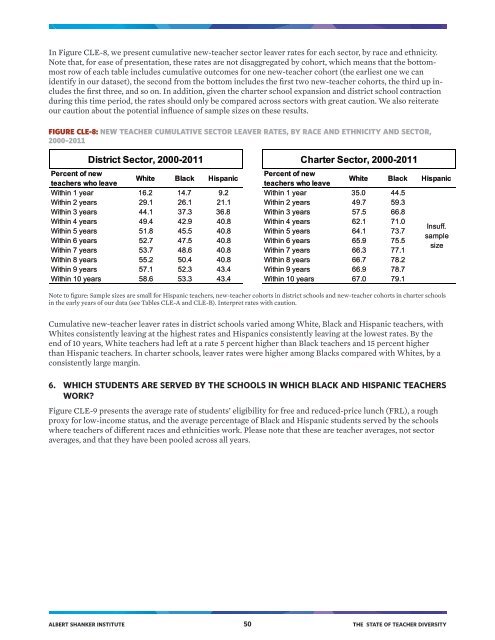
In Figure CLE-8, we present cumulative new-teacher sector leaver rates for each sector, by race and ethnicity.<br />
Note that, for ease of presentation, these rates are not disaggregated by cohort, which means that the bottommost<br />
row of each table includes cumulative outcomes for one new-teacher cohort (the earliest one we can<br />
identify in our dataset), the second from the bottom includes the first two new-teacher cohorts, the third up includes<br />
the first three, and so on. In addition, given the charter school expansion and district school contraction<br />
during this time period, the rates should only be compared across sectors with great caution. We also reiterate<br />
our caution about the potential influence of sample sizes on these results.<br />
FIGURE CLE-8: NEW <strong>TEACHER</strong> CUMULATIVE SECTOR LEAVER RATES, BY RACE AND ETHNICITY AND SECTOR,<br />
2000–2011<br />
District Sector, 2000-2011 Charter Sector, 2000-2011<br />
Percent of new<br />
Percent of new<br />
White Black Hispanic<br />
teachers who leave<br />
teachers who leave<br />
White Black Hispanic<br />
Within 1 year 16.2 14.7 9.2 Within 1 year 35.0 44.5<br />
Within 2 years 29.1 26.1 21.1 Within 2 years 49.7 59.3<br />
Within 3 years 44.1 37.3 36.8 Within 3 years 57.5 66.8<br />
Within 4 years 49.4 42.9 40.8 Within 4 years 62.1 71.0<br />
Insuff.<br />
Within 5 years 51.8 45.5 40.8 Within 5 years 64.1 73.7<br />
sample<br />
Within 6 years 52.7 47.5 40.8 Within 6 years 65.9 75.5<br />
size<br />
Within 7 years 53.7 48.6 40.8 Within 7 years 66.3 77.1<br />
Within 8 years 55.2 50.4 40.8 Within 8 years 66.7 78.2<br />
Within 9 years 57.1 52.3 43.4 Within 9 years 66.9 78.7<br />
Within 10 years 58.6 53.3 43.4 Within 10 years 67.0 79.1<br />
Note to figure: Sample sizes are small for Hispanic teachers, new-teacher cohorts in district schools and new-teacher cohorts in charter schools<br />
in the early years of our data (see Tables CLE-A and CLE-B). Interpret rates with caution.<br />
Cumulative new-teacher leaver rates in district schools varied among White, Black and Hispanic teachers, with<br />
Whites consistently leaving at the highest rates and Hispanics consistently leaving at the lowest rates. By the<br />
end of 10 years, White teachers had left at a rate 5 percent higher than Black teachers and 15 percent higher<br />
than Hispanic teachers. In charter schools, leaver rates were higher among Blacks compared with Whites, by a<br />
consistently large margin.<br />
6. WHICH STUDENTS ARE SERVED BY THE SCHOOLS IN WHICH BLACK AND HISPANIC <strong>TEACHER</strong>S<br />
WORK?<br />
Figure CLE-9 presents the average rate of students’ eligibility for free and reduced-price lunch (FRL), a rough<br />
proxy for low-income status, and the average percentage of Black and Hispanic students served by the schools<br />
where teachers of different races and ethnicities work. Please note that these are teacher averages, not sector<br />
averages, and that they have been pooled across all years.<br />
ALBERT SHANKER INSTITUTE 50 THE STATE OF <strong>TEACHER</strong> <strong>DIVERSITY</strong>