

TEACHER DIVERSITY
The State of Teacher Diversity_0
The State of Teacher Diversity_0
- No tags were found...

Create successful ePaper yourself
Turn your PDF publications into a flip-book with our unique Google optimized e-Paper software.
As you can see, differences in group sizes for the various racial and ethnic categories can mean that relatively<br />
modest changes in one group’s proportional share can actually represent a fairly large shift within that category.<br />
For example, while the proportion of White teachers in the district declined by only 5 percentage points, the<br />
actual number of White teachers fell by nearly 22 percent. Similarly, while the Black share of the teacher force<br />
fell by only about 2 points, the number of Black teachers actually declined by a hefty 32 percent. Meanwhile,<br />
the share of Asian and Hispanic teachers, which grew at similar rates of 3-4 percent, represented a 12 percent<br />
increase in the number of Asian teachers but an 8 percent increase in the number of Hispanic teachers.<br />
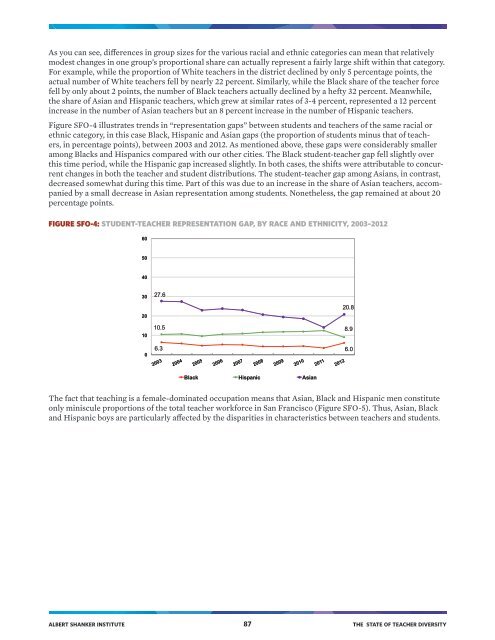
Figure SFO-4 illustrates trends in “representation gaps” between students and teachers of the same racial or<br />
ethnic category, in this case Black, Hispanic and Asian gaps (the proportion of students minus that of teachers,<br />
in percentage points), between 2003 and 2012. As mentioned above, these gaps were considerably smaller<br />
among Blacks and Hispanics compared with our other cities. The Black student-teacher gap fell slightly over<br />
this time period, while the Hispanic gap increased slightly. In both cases, the shifts were attributable to concurrent<br />
changes in both the teacher and student distributions. The student-teacher gap among Asians, in contrast,<br />
decreased somewhat during this time. Part of this was due to an increase in the share of Asian teachers, accompanied<br />
by a small decrease in Asian representation among students. Nonetheless, the gap remained at about 20<br />
percentage points.<br />
FIGURE SFO-4: STUDENT-<strong>TEACHER</strong> REPRESENTATION GAP, BY RACE AND ETHNICITY, 2003–2012<br />
60<br />
50<br />
40<br />
30<br />
27.6<br />
20<br />
10<br />
0<br />
20.8<br />
10.5 8.9<br />
6.3 6.0<br />
Black Hispanic Asian<br />
The fact that teaching is a female-dominated occupation means that Asian, Black and Hispanic men constitute<br />
only miniscule proportions of the total teacher workforce in San Francisco (Figure SFO-5). Thus, Asian, Black<br />
and Hispanic boys are particularly affected by the disparities in characteristics between teachers and students.<br />
ALBERT SHANKER INSTITUTE 87 THE STATE OF <strong>TEACHER</strong> <strong>DIVERSITY</strong>