

TEACHER DIVERSITY
The State of Teacher Diversity_0
The State of Teacher Diversity_0
- No tags were found...

You also want an ePaper? Increase the reach of your titles
YUMPU automatically turns print PDFs into web optimized ePapers that Google loves.
As you can see, the proportion of new hires who were Asian was consistently lower than the proportion of<br />
Asians employed in the previous year, usually by 5-7 percentage points. By contrast, the proportion of Black new<br />
hires was consistently similar to existing proportions. The pattern for Hispanic new hires was also relatively<br />
stable, though there was a bit more fluctuation for this group. Only among White teachers were new hires consistently<br />
overrepresented relative to previous years (by about 5 percentage points, on average).<br />
5. ARE SECTOR LEAVING PATTERNS SERVING TO DIVERSIFY SAN FRANCISCO’S PUBLIC SCHOOL<br />
<strong>TEACHER</strong>S?<br />
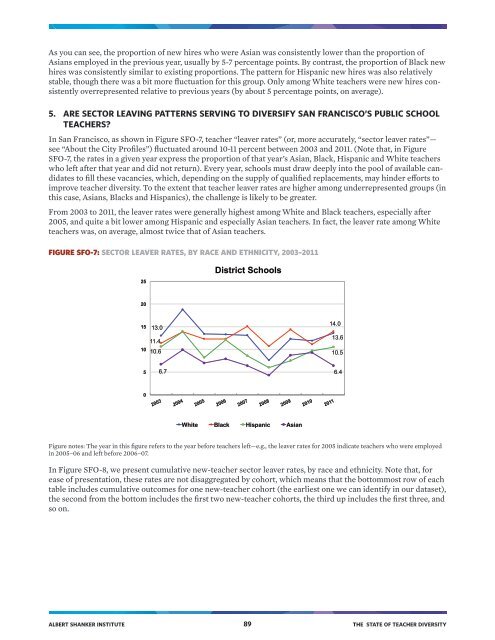
In San Francisco, as shown in Figure SFO-7, teacher “leaver rates” (or, more accurately, “sector leaver rates”—<br />
see “About the City Profiles”) fluctuated around 10-11 percent between 2003 and 2011. (Note that, in Figure<br />
SFO-7, the rates in a given year express the proportion of that year’s Asian, Black, Hispanic and White teachers<br />
who left after that year and did not return). Every year, schools must draw deeply into the pool of available candidates<br />
to fill these vacancies, which, depending on the supply of qualified replacements, may hinder efforts to<br />
improve teacher diversity. To the extent that teacher leaver rates are higher among underrepresented groups (in<br />
this case, Asians, Blacks and Hispanics), the challenge is likely to be greater.<br />
From 2003 to 2011, the leaver rates were generally highest among White and Black teachers, especially after<br />
2005, and quite a bit lower among Hispanic and especially Asian teachers. In fact, the leaver rate among White<br />
teachers was, on average, almost twice that of Asian teachers.<br />
FIGURE SFO-7: SECTOR LEAVER RATES, BY RACE AND ETHNICITY, 2003–2011<br />
25<br />
District Schools<br />
20<br />
15<br />
10<br />
13.0<br />
11.4<br />
14.0<br />
13.6<br />
10.6 10.5<br />
5<br />
6.7 6.4<br />
0<br />
White Black Hispanic Asian<br />
Figure notes: The year in this figure refers to the year before teachers left—e.g., the leaver rates for 2005 indicate teachers who were employed<br />
in 2005–06 and left before 2006–07.<br />
In Figure SFO-8, we present cumulative new-teacher sector leaver rates, by race and ethnicity. Note that, for<br />
ease of presentation, these rates are not disaggregated by cohort, which means that the bottommost row of each<br />
table includes cumulative outcomes for one new-teacher cohort (the earliest one we can identify in our dataset),<br />
the second from the bottom includes the first two new-teacher cohorts, the third up includes the first three, and<br />
so on.<br />
ALBERT SHANKER INSTITUTE 89 THE STATE OF <strong>TEACHER</strong> <strong>DIVERSITY</strong>