

TEACHER DIVERSITY
The State of Teacher Diversity_0
The State of Teacher Diversity_0
- No tags were found...

You also want an ePaper? Increase the reach of your titles
YUMPU automatically turns print PDFs into web optimized ePapers that Google loves.
Teacher and Student Diversity<br />
in Phildadelphia Public Schools<br />
1. SUMMARY OF FINDINGS<br />
In 2012, 3 in 4 Philadelphia students were Black or Hispanic,<br />
compared with just over 1 in 4 teachers. During the period<br />
PHILADELPHIA DATASET<br />
of time for which we have data, the White share of the<br />
district teaching force increased modestly, the Black share<br />
decreased modestly, and Hispanic representation, historically<br />
small, remained roughly the same. In terms of changes<br />
in actual numbers, the number of White and Hispanic<br />
teachers increased, while Black teachers experienced a<br />
population loss of nearly 19 percent. These trends were due<br />
in part to hiring patterns in district schools, in which new<br />
White teachers were consistently overrepresented while<br />
new Black teachers were consistently underrepresented, as<br />
well as comparatively high sector leaver rates among Black<br />
Type of data<br />
Years available<br />
Linked b/w years<br />
Multiracial category<br />
Total sample size<br />
District<br />
Teacher level<br />
2001–2012<br />
Yes<br />
No<br />
127,046<br />
Charter<br />
Teacher level<br />
2007–2012<br />
Yes<br />
Yes<br />
14,083<br />
teachers working in charter schools particularly in the last years of our data.<br />
2. SNAPSHOT OF <strong>TEACHER</strong> AND STUDENT RACE AND ETHNICITY IN PHILADELPHIA PUBLIC<br />
SCHOOLS<br />
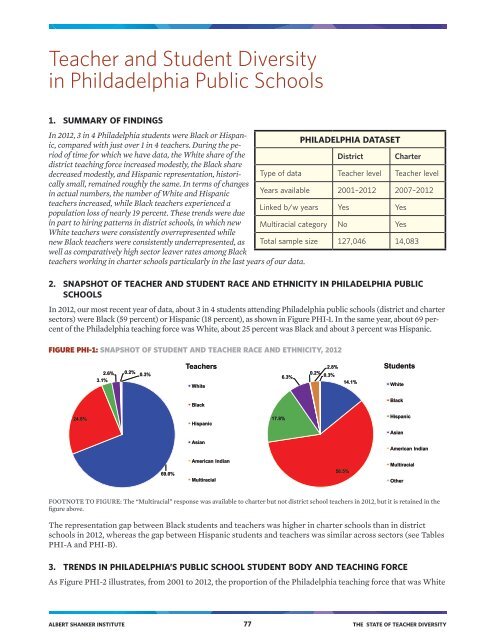
In 2012, our most recent year of data, about 3 in 4 students attending Philadelphia public schools (district and charter<br />
sectors) were Black (59 percent) or Hispanic (18 percent), as shown in Figure PHI-1. In the same year, about 69 percent<br />
of the Philadelphia teaching force was White, about 25 percent was Black and about 3 percent was Hispanic.<br />
FIGURE PHI-1: SNAPSHOT OF STUDENT AND <strong>TEACHER</strong> RACE AND ETHNICITY, 2012<br />
Teachers<br />
2.6% 0.2% 0.3%<br />
3.1%<br />
White<br />
6.3%<br />
2.8%<br />
0.2%<br />
0.3%<br />
14.1%<br />
Students<br />
White<br />
Black<br />
Black<br />
24.8%<br />
Hispanic<br />
17.8%<br />
Hispanic<br />
Asian<br />
Asian<br />
American Indian<br />
69.0%<br />
American Indian<br />
Multiracial<br />
58.5%<br />
Multiracial<br />
Other<br />
FOOTNOTE TO FIGURE: The “Multiracial” response was available to charter but not district school teachers in 2012, but it is retained in the<br />
figure above.<br />
The representation gap between Black students and teachers was higher in charter schools than in district<br />
schools in 2012, whereas the gap between Hispanic students and teachers was similar across sectors (see Tables<br />
PHI-A and PHI-B).<br />
3. TRENDS IN PHILADELPHIA’S PUBLIC SCHOOL STUDENT BODY AND TEACHING FORCE<br />
As Figure PHI-2 illustrates, from 2001 to 2012, the proportion of the Philadelphia teaching force that was White<br />
ALBERT SHANKER INSTITUTE 77 THE STATE OF <strong>TEACHER</strong> <strong>DIVERSITY</strong>