TEACHER DIVERSITY
The State of Teacher Diversity_0
The State of Teacher Diversity_0
- No tags were found...
Create successful ePaper yourself
Turn your PDF publications into a flip-book with our unique Google optimized e-Paper software.
Angeles has made in narrowing this gap, despite the change in student demographics, is laudable. Indeed, Los<br />
Angeles stands out as the one city that has seen significant growth of the Hispanic teacher share in both the<br />
district and charter sectors.<br />
The city profiles reveal that the representation gaps for Black and Hispanic male teachers and students are particularly<br />
wide—an unfortunate intersection of the fact that teaching is a predominantly female occupation and<br />
the generally low representation rates for racial and ethnic minorities.<br />
Further, the city profiles show that the representation gaps for Black and Hispanic teachers and students are<br />
more pronounced in the charter sector. Among our cities, charter teaching forces tend to be whiter and charter<br />
student populations blacker and browner than their district counterparts. But in every city, charter schools<br />
and district schools are both contributing to the overall student-teacher representation gaps among Blacks and<br />
Hispanics.<br />
TRENDS IN <strong>TEACHER</strong> <strong>DIVERSITY</strong><br />
As one digs deeper into what has been happening in our nine cities, disquieting trends that depart from the<br />
national trends begin to appear. Specifically, we are very troubled by the fact that, in every city and every sector,<br />
the share of Black teachers in the workforce has been declining at rates ranging from the slight to the massive—<br />
from roughly 1 percent in Boston’s charter sector and Cleveland’s district sector, to more than 24 percent in<br />
New Orleans (combined sectors) and nearly 28 percent in Washington, D.C. (combined sectors).<br />
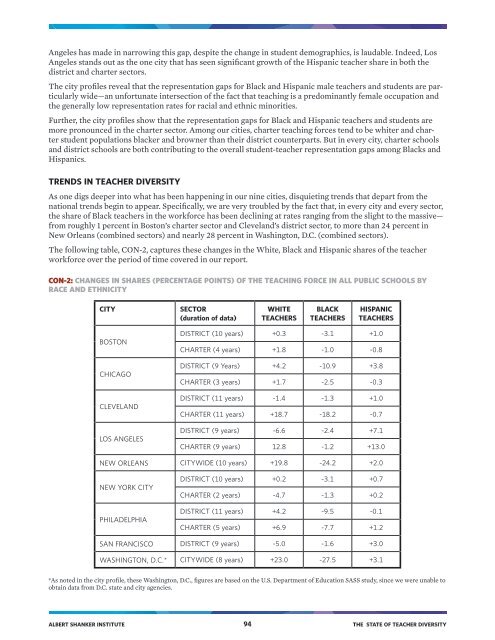
The following table, CON-2, captures these changes in the White, Black and Hispanic shares of the teacher<br />
workforce over the period of time covered in our report.<br />
CON-2: CHANGES IN SHARES (PERCENTAGE POINTS) OF THE TEACHING FORCE IN ALL PUBLIC SCHOOLS BY<br />
RACE AND ETHNICITY<br />
CITY<br />
SECTOR<br />
(duration of data)<br />
WHITE<br />
<strong>TEACHER</strong>S<br />
BLACK<br />
<strong>TEACHER</strong>S<br />
HISPANIC<br />
<strong>TEACHER</strong>S<br />
BOSTON<br />
CHICAGO<br />
CLEVELAND<br />
LOS ANGELES<br />
DISTRICT (10 years) +0.3 -3.1 +1.0<br />
CHARTER (4 years) +1.8 -1.0 -0.8<br />
DISTRICT (9 Years) +4.2 -10.9 +3.8<br />
CHARTER (3 years) +1.7 -2.5 -0.3<br />
DISTRICT (11 years) -1.4 -1.3 +1.0<br />
CHARTER (11 years) +18.7 -18.2 -0.7<br />
DISTRICT (9 years) -6.6 -2.4 +7.1<br />
CHARTER (9 years) 12.8 -1.2 +13.0<br />
NEW ORLEANS CITYWIDE (10 years) +19.8 -24.2 +2.0<br />
NEW YORK CITY<br />
PHILADELPHIA<br />
DISTRICT (10 years) +0.2 -3.1 +0.7<br />
CHARTER (2 years) -4.7 -1.3 +0.2<br />
DISTRICT (11 years) +4.2 -9.5 -0.1<br />
CHARTER (5 years) +6.9 -7.7 +1.2<br />
SAN FRANCISCO DISTRICT (9 years) -5.0 -1.6 +3.0<br />
WASHINGTON, D.C.* CITYWIDE (8 years) +23.0 -27.5 +3.1<br />
*As noted in the city profile, these Washington, D.C., figures are based on the U.S. Department of Education SASS study, since we were unable to<br />
obtain data from D.C. state and city agencies.<br />
ALBERT SHANKER INSTITUTE 94 THE STATE OF <strong>TEACHER</strong> <strong>DIVERSITY</strong>


