

TEACHER DIVERSITY
The State of Teacher Diversity_0
The State of Teacher Diversity_0
- No tags were found...

Create successful ePaper yourself
Turn your PDF publications into a flip-book with our unique Google optimized e-Paper software.
The proportion of Black new hires in district schools was consistently below (by 5-8 percentage points every<br />
year) the proportion of Black teachers in the district workforce the previous year. Asians and Hispanics were<br />
also underrepresented among new hires, but only modestly. By contrast, the share of new White teachers was<br />
consistently higher (in most years, by more than 5 percentage points) than in the previous year’s teaching force.<br />
5. ARE SECTOR LEAVING PATTERNS SERVING TO DIVERSIFY NEW YORK CITY’S PUBLIC SCHOOL<br />
<strong>TEACHER</strong>S?<br />
Teacher “leaver rates” (or, more accurately, “sector leaver rates”—see “About the City Profiles”) in New York<br />
City district schools declined over the course of our study. Even so, between 2011 and 2012, more than 8 percent<br />
of the city’s teachers in our dataset left the district. (Note that the rates in a given year express the proportion<br />
of that year’s Black, White, Asian and Hispanic teachers who were not in the district in any subsequent year.)<br />
Every year, schools must draw deeply into the pool of available candidates to fill these vacancies, which, depending<br />
on the supply of qualified replacements, may hinder efforts to improve teacher diversity. To the extent<br />
that teacher leaver rates are higher among underrepresented groups (in this case, Asians, Blacks and Hispanics),<br />
the challenge is likely to be greater.<br />
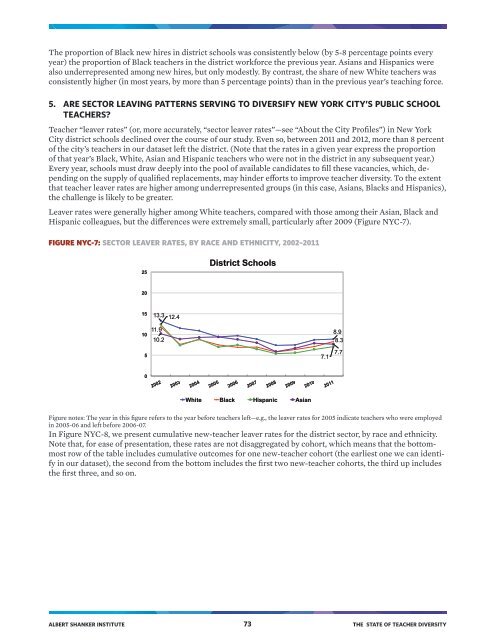
Leaver rates were generally higher among White teachers, compared with those among their Asian, Black and<br />
Hispanic colleagues, but the differences were extremely small, particularly after 2009 (Figure NYC-7).<br />
FIGURE NYC-7: SECTOR LEAVER RATES, BY RACE AND ETHNICITY, 2002–2011<br />
25<br />
District Schools<br />
20<br />
15<br />
13.3<br />
12.4<br />
10<br />
11.9<br />
10.2<br />
8.9<br />
8.3<br />
5<br />
7.1<br />
7.7<br />
0<br />
White Black Hispanic Asian<br />
Figure notes: The year in this figure refers to the year before teachers left—e.g., the leaver rates for 2005 indicate teachers who were employed<br />
in 2005-06 and left before 2006-07.<br />
In Figure NYC-8, we present cumulative new-teacher leaver rates for the district sector, by race and ethnicity.<br />
Note that, for ease of presentation, these rates are not disaggregated by cohort, which means that the bottommost<br />
row of the table includes cumulative outcomes for one new-teacher cohort (the earliest one we can identify<br />
in our dataset), the second from the bottom includes the first two new-teacher cohorts, the third up includes<br />
the first three, and so on.<br />
ALBERT SHANKER INSTITUTE 73 THE STATE OF <strong>TEACHER</strong> <strong>DIVERSITY</strong>