

TEACHER DIVERSITY
The State of Teacher Diversity_0
The State of Teacher Diversity_0
- No tags were found...

You also want an ePaper? Increase the reach of your titles
YUMPU automatically turns print PDFs into web optimized ePapers that Google loves.
As Figure NYC-3 shows, differences in group sizes for the various racial and ethnic categories can mean that<br />
relatively modest changes in one group’s proportional share can actually represent a fairly large shift within that<br />
category. For example, the small number of Asian teachers meant that, even as their share of the total teaching<br />
force grew by 2 percentage points, their numbers actually grew by nearly 53 percent. The proportion of White<br />
and Hispanic teachers in the district, which remained fairly stable, represented a modest 2 percent decline in<br />
numbers for both groups. Meanwhile, the 3-point decrease in the share of all teachers who were Black represented<br />
a 15 percent decline in the total number of Black teachers.<br />
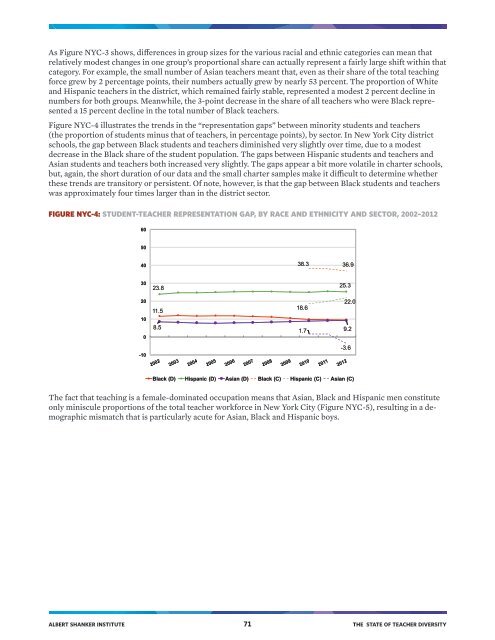
Figure NYC-4 illustrates the trends in the “representation gaps” between minority students and teachers<br />
(the proportion of students minus that of teachers, in percentage points), by sector. In New York City district<br />
schools, the gap between Black students and teachers diminished very slightly over time, due to a modest<br />
decrease in the Black share of the student population. The gaps between Hispanic students and teachers and<br />
Asian students and teachers both increased very slightly. The gaps appear a bit more volatile in charter schools,<br />
but, again, the short duration of our data and the small charter samples make it difficult to determine whether<br />
these trends are transitory or persistent. Of note, however, is that the gap between Black students and teachers<br />
was approximately four times larger than in the district sector.<br />
FIGURE NYC-4: STUDENT-<strong>TEACHER</strong> REPRESENTATION GAP, BY RACE AND ETHNICITY AND SECTOR, 2002–2012<br />
60<br />
50<br />
40<br />
38.3 36.9<br />
30<br />
23.8<br />
25.3<br />
20<br />
10<br />
0<br />
-10<br />
22.0<br />
11.5<br />
18.6<br />
8.5<br />
1.7<br />
9.2<br />
-3.6<br />
Black (D) Hispanic (D) Asian (D) Black (C) Hispanic (C) Asian (C)<br />
The fact that teaching is a female-dominated occupation means that Asian, Black and Hispanic men constitute<br />
only miniscule proportions of the total teacher workforce in New York City (Figure NYC-5), resulting in a demographic<br />
mismatch that is particularly acute for Asian, Black and Hispanic boys.<br />
ALBERT SHANKER INSTITUTE 71 THE STATE OF <strong>TEACHER</strong> <strong>DIVERSITY</strong>