Queens
northeast_queens_bus_study_-_final_9-28-15
northeast_queens_bus_study_-_final_9-28-15

Create successful ePaper yourself
Turn your PDF publications into a flip-book with our unique Google optimized e-Paper software.
, Metropolitan Transportation Authority<br />
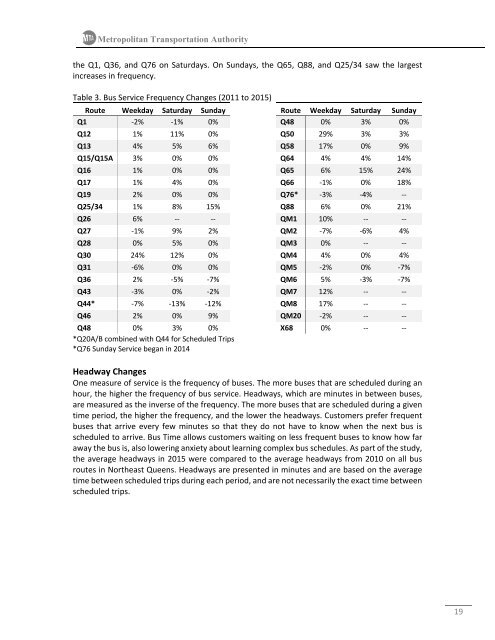
the Q1, Q36, and Q76 on Saturdays. On Sundays, the Q65, Q88, and Q25/34 saw the largest<br />
increases in frequency.<br />
Table 3. Bus Service Frequency Changes (2011 to 2015)<br />
Route Weekday Saturday Sunday Route Weekday Saturday Sunday<br />
Q1 ‐2% ‐1% 0% Q48 0% 3% 0%<br />
Q12 1% 11% 0% Q50 29% 3% 3%<br />
Q13 4% 5% 6% Q58 17% 0% 9%<br />
Q15/Q15A 3% 0% 0% Q64 4% 4% 14%<br />
Q16 1% 0% 0% Q65 6% 15% 24%<br />
Q17 1% 4% 0% Q66 ‐1% 0% 18%<br />
Q19 2% 0% 0% Q76* ‐3% ‐4% ‐‐<br />
Q25/34 1% 8% 15% Q88 6% 0% 21%<br />
Q26 6% ‐‐ ‐‐ QM1 10% ‐‐ ‐‐<br />
Q27 ‐1% 9% 2% QM2 ‐7% ‐6% 4%<br />
Q28 0% 5% 0% QM3 0% ‐‐ ‐‐<br />
Q30 24% 12% 0% QM4 4% 0% 4%<br />
Q31 ‐6% 0% 0% QM5 ‐2% 0% ‐7%<br />
Q36 2% ‐5% ‐7% QM6 5% ‐3% ‐7%<br />
Q43 ‐3% 0% ‐2% QM7 12% ‐‐ ‐‐<br />
Q44* ‐7% ‐13% ‐12% QM8 17% ‐‐ ‐‐<br />
Q46 2% 0% 9% QM20 ‐2% ‐‐ ‐‐<br />
Q48 0% 3% 0% X68 0% ‐‐ ‐‐<br />
*Q20A/B combined with Q44 for Scheduled Trips<br />
*Q76 Sunday Service began in 2014<br />
Headway Changes<br />
One measure of service is the frequency of buses. The more buses that are scheduled during an<br />
hour, the higher the frequency of bus service. Headways, which are minutes in between buses,<br />
are measured as the inverse of the frequency. The more buses that are scheduled during a given<br />
time period, the higher the frequency, and the lower the headways. Customers prefer frequent<br />
buses that arrive every few minutes so that they do not have to know when the next bus is<br />
scheduled to arrive. Bus Time allows customers waiting on less frequent buses to know how far<br />
away the bus is, also lowering anxiety about learning complex bus schedules. As part of the study,<br />
the average headways in 2015 were compared to the average headways from 2010 on all bus<br />
routes in Northeast <strong>Queens</strong>. Headways are presented in minutes and are based on the average<br />
time between scheduled trips during each period, and are not necessarily the exact time between<br />
scheduled trips.<br />
19