, Metropolitan Transportation Authority Methodology This study evaluates current bus service in Northeast <strong>Queens</strong> using various sources of data and community input. These data primarily include Bus Time GPS data and Automatic Fare Collection MetroCard data. This study examined a large amount of archived Bus Time data, integrated with Automatic Fare Collection (AFC) data from MetroCards. The data were captured and analyzed to evaluate bus service, performance, and ridership. This methodology provided service planners with a comprehensive dataset based on 100% of actual data. Since the launch of Bus Time for <strong>Queens</strong> buses in 2014, real time automatic vehicle location information is available for all buses. These data are captured and stored to evaluate bus service, performance, and ridership, supplementing the prior system of manual data sampling with traffic counts. With the data captured from Bus Time, wait assessment and on‐time performance data are calculated. These metrics, along with service availability and passenger environment scores, were evaluated to determine quality of service. Automatic Fare Collection MetroCard data provided ridership and transfer information. Community input was received at meetings of the Public Transit/Transportation Committees of <strong>Queens</strong> Community Boards 7, 8, 11, and 13 between October 2014 and April 2015, as well as a public workshop held on February 26, 2015 at <strong>Queens</strong>borough Community College. More than 100 participants attended the Northeast <strong>Queens</strong> Bus Study Public Workshop. This provided an opportunity for community residents to speak directly to bus service planners about bus service in the area. Further comments were collected by the office of Senator Avella and forwarded to the MTA for consideration and analysis. Characteristics of Northeast <strong>Queens</strong> Northeast <strong>Queens</strong> is a large area that covers 31 square miles. The study area is bounded by Flushing Bay and the Van Wyck Expressway to the west, Hillside Avenue to the south, the Nassau County line to the east, and the East River to the north. This study area is composed of the following neighborhoods: Flushing, Whitestone, Bay Terrace, Bayside, College Point, Oakland Gardens, Douglaston, Glen Oaks, Fresh Meadows, Little Neck, Mitchell‐Linden, Bowne Park, Beechhurst, Bellerose, Fort Totten, Malba, Robinwood, Auburndale, Floral Park, Hollis Hills, <strong>Queens</strong> Village, and New Hyde Park in addition to others. Northeast <strong>Queens</strong> spans Community Boards 7,8,11, and 13. Downtown Flushing is the major economic center and transportation hub within the area. Major educational institutions include <strong>Queens</strong> College, St. Johns University, and <strong>Queens</strong>borough Community College. There are also several large high schools within the study area. Schools are one of the largest generators of bus customers in Northeast <strong>Queens</strong>. Other community facilities and parks in the study area include <strong>Queens</strong> Botanical Garden, Kissena Park, <strong>Queens</strong> County Farm Museum and Alley Pond Park. Large institutions such as the NY Hospital Center of <strong>Queens</strong>, Long Island Jewish Hospital, Creedmoor State Hospital, and Flushing Hospital are also located in the area. 4
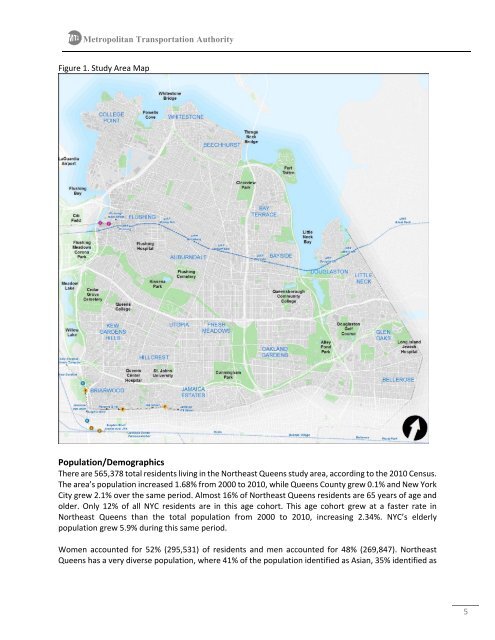
, Metropolitan Transportation Authority Figure 1. Study Area Map Population/Demographics There are 565,378 total residents living in the Northeast <strong>Queens</strong> study area, according to the 2010 Census. The area’s population increased 1.68% from 2000 to 2010, while <strong>Queens</strong> County grew 0.1% and New York City grew 2.1% over the same period. Almost 16% of Northeast <strong>Queens</strong> residents are 65 years of age and older. Only 12% of all NYC residents are in this age cohort. This age cohort grew at a faster rate in Northeast <strong>Queens</strong> than the total population from 2000 to 2010, increasing 2.34%. NYC’s elderly population grew 5.9% during this same period. Women accounted for 52% (295,531) of residents and men accounted for 48% (269,847). Northeast <strong>Queens</strong> has a very diverse population, where 41% of the population identified as Asian, 35% identified as 5
- Page 1: Northeast Queens BUS STUDY , METROP
- Page 4 and 5: , Metropolitan Transportation Autho
- Page 6 and 7: , Metropolitan Transportation Autho
- Page 10 and 11: , Metropolitan Transportation Autho
- Page 12 and 13: , Metropolitan Transportation Autho
- Page 14 and 15: , Metropolitan Transportation Autho
- Page 16 and 17: , Metropolitan Transportation Autho
- Page 18 and 19: , Metropolitan Transportation Autho
- Page 20 and 21: , Metropolitan Transportation Autho
- Page 22 and 23: , Metropolitan Transportation Autho
- Page 24 and 25: , Metropolitan Transportation Autho
- Page 26 and 27: , Metropolitan Transportation Autho
- Page 28 and 29: , Metropolitan Transportation Autho
- Page 30 and 31: , Metropolitan Transportation Autho
- Page 32 and 33: , Metropolitan Transportation Autho
- Page 34 and 35: , Metropolitan Transportation Autho
- Page 36 and 37: , Metropolitan Transportation Autho
- Page 38 and 39: , Metropolitan Transportation Autho
- Page 40 and 41: , Metropolitan Transportation Autho
- Page 42 and 43: , Metropolitan Transportation Autho
- Page 44 and 45: , Metropolitan Transportation Autho
- Page 46 and 47: , Metropolitan Transportation Autho
- Page 48 and 49: , Metropolitan Transportation Autho
- Page 50 and 51: , Metropolitan Transportation Autho
- Page 52 and 53: , Metropolitan Transportation Autho
- Page 54 and 55: , Metropolitan Transportation Autho
- Page 56 and 57: , Metropolitan Transportation Autho
- Page 58 and 59:
, Metropolitan Transportation Autho
- Page 60 and 61:
, Metropolitan Transportation Autho
- Page 62 and 63:
, Metropolitan Transportation Autho
- Page 64 and 65:
, Metropolitan Transportation Autho
- Page 66 and 67:
, Metropolitan Transportation Autho
- Page 68 and 69:
, Metropolitan Transportation Autho
- Page 70 and 71:
, Metropolitan Transportation Autho
- Page 72 and 73:
, Metropolitan Transportation Autho
- Page 74 and 75:
, Metropolitan Transportation Autho
- Page 76 and 77:
, Metropolitan Transportation Autho
- Page 78 and 79:
, Metropolitan Transportation Autho
- Page 80 and 81:
, Metropolitan Transportation Autho
- Page 82 and 83:
, Metropolitan Transportation Autho
- Page 84 and 85:
, Metropolitan Transportation Autho
- Page 86 and 87:
, Metropolitan Transportation Autho
- Page 88 and 89:
, Metropolitan Transportation Autho
- Page 90 and 91:
, Metropolitan Transportation Autho
- Page 92 and 93:
, Metropolitan Transportation Autho
- Page 94 and 95:
, Metropolitan Transportation Autho
- Page 96 and 97:
, Metropolitan Transportation Autho
- Page 98 and 99:
, Metropolitan Transportation Autho
- Page 100 and 101:
, Metropolitan Transportation Autho
- Page 102 and 103:
, Metropolitan Transportation Autho
- Page 104 and 105:
, Metropolitan Transportation Autho
- Page 106 and 107:
, Metropolitan Transportation Autho
- Page 108 and 109:
, Metropolitan Transportation Autho
- Page 110 and 111:
, Metropolitan Transportation Autho
- Page 112 and 113:
, Metropolitan Transportation Autho
- Page 114 and 115:
, Metropolitan Transportation Autho
- Page 116 and 117:
, Metropolitan Transportation Autho
- Page 118 and 119:
, Metropolitan Transportation Autho
- Page 120 and 121:
, Metropolitan Transportation Autho
- Page 122 and 123:
, Metropolitan Transportation Autho
- Page 124 and 125:
, Metropolitan Transportation Autho
- Page 126 and 127:
, Metropolitan Transportation Autho
- Page 128 and 129:
, Metropolitan Transportation Autho
- Page 130:
, Metropolitan Transportation Autho