Queens
northeast_queens_bus_study_-_final_9-28-15
northeast_queens_bus_study_-_final_9-28-15
You also want an ePaper? Increase the reach of your titles
YUMPU automatically turns print PDFs into web optimized ePapers that Google loves.
, Metropolitan Transportation Authority<br />
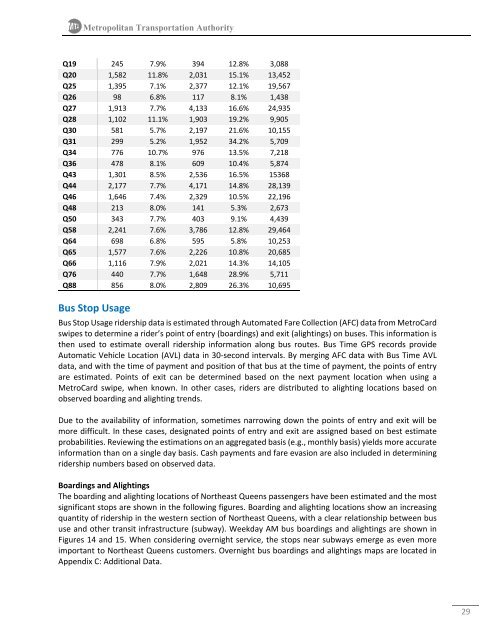
Q19 245 7.9% 394 12.8% 3,088<br />
Q20 1,582 11.8% 2,031 15.1% 13,452<br />
Q25 1,395 7.1% 2,377 12.1% 19,567<br />
Q26 98 6.8% 117 8.1% 1,438<br />
Q27 1,913 7.7% 4,133 16.6% 24,935<br />
Q28 1,102 11.1% 1,903 19.2% 9,905<br />
Q30 581 5.7% 2,197 21.6% 10,155<br />
Q31 299 5.2% 1,952 34.2% 5,709<br />
Q34 776 10.7% 976 13.5% 7,218<br />
Q36 478 8.1% 609 10.4% 5,874<br />
Q43 1,301 8.5% 2,536 16.5% 15368<br />
Q44 2,177 7.7% 4,171 14.8% 28,139<br />
Q46 1,646 7.4% 2,329 10.5% 22,196<br />
Q48 213 8.0% 141 5.3% 2,673<br />
Q50 343 7.7% 403 9.1% 4,439<br />
Q58 2,241 7.6% 3,786 12.8% 29,464<br />
Q64 698 6.8% 595 5.8% 10,253<br />
Q65 1,577 7.6% 2,226 10.8% 20,685<br />
Q66 1,116 7.9% 2,021 14.3% 14,105<br />
Q76 440 7.7% 1,648 28.9% 5,711<br />
Q88 856 8.0% 2,809 26.3% 10,695<br />
Bus Stop Usage<br />
Bus Stop Usage ridership data is estimated through Automated Fare Collection (AFC) data from MetroCard<br />
swipes to determine a rider’s point of entry (boardings) and exit (alightings) on buses. This information is<br />
then used to estimate overall ridership information along bus routes. Bus Time GPS records provide<br />
Automatic Vehicle Location (AVL) data in 30‐second intervals. By merging AFC data with Bus Time AVL<br />
data, and with the time of payment and position of that bus at the time of payment, the points of entry<br />
are estimated. Points of exit can be determined based on the next payment location when using a<br />
MetroCard swipe, when known. In other cases, riders are distributed to alighting locations based on<br />
observed boarding and alighting trends.<br />
Due to the availability of information, sometimes narrowing down the points of entry and exit will be<br />
more difficult. In these cases, designated points of entry and exit are assigned based on best estimate<br />
probabilities. Reviewing the estimations on an aggregated basis (e.g., monthly basis) yields more accurate<br />
information than on a single day basis. Cash payments and fare evasion are also included in determining<br />
ridership numbers based on observed data.<br />
Boardings and Alightings<br />
The boarding and alighting locations of Northeast <strong>Queens</strong> passengers have been estimated and the most<br />
significant stops are shown in the following figures. Boarding and alighting locations show an increasing<br />
quantity of ridership in the western section of Northeast <strong>Queens</strong>, with a clear relationship between bus<br />
use and other transit infrastructure (subway). Weekday AM bus boardings and alightings are shown in<br />
Figures 14 and 15. When considering overnight service, the stops near subways emerge as even more<br />
important to Northeast <strong>Queens</strong> customers. Overnight bus boardings and alightings maps are located in<br />
Appendix C: Additional Data.<br />
29


