

AFRICAN
ahm20
ahm20

Create successful ePaper yourself
Turn your PDF publications into a flip-book with our unique Google optimized e-Paper software.
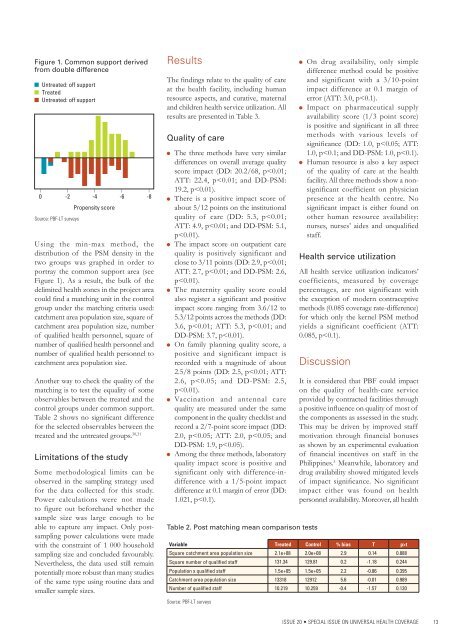
Figure 1. Common support derived<br />
from double difference<br />
Untreated: off support<br />
Treated<br />
Untreated: off support<br />
l<br />
0<br />
l<br />
-2<br />
Source: PBF-LT surveys<br />
l<br />
-4<br />
Propensity score<br />
l<br />
-6<br />
Using the min-max method, the<br />
distribution of the PSM density in the<br />
two groups was graphed in order to<br />
portray the common support area (see<br />
Figure 1). As a result, the bulk of the<br />
delimited health zones in the project area<br />
could find a matching unit in the control<br />
group under the matching criteria used:<br />
catchment area population size, square of<br />
catchment area population size, number<br />
of qualified health personnel, square of<br />
number of qualified health personnel and<br />
number of qualified health personnel to<br />
catchment area population size.<br />
Another way to check the quality of the<br />
matching is to test the equality of some<br />
observables between the treated and the<br />
control groups under common support.<br />
Table 2 shows no significant difference<br />
for the selected observables between the<br />
treated and the untreated groups. 30,31<br />
Limitations of the study<br />
l<br />
-8<br />
Some methodological limits can be<br />
observed in the sampling strategy used<br />
for the data collected for this study.<br />
Power calculations were not made<br />
to figure out beforehand whether the<br />
sample size was large enough to be<br />
able to capture any impact. Only postsampling<br />
power calculations were made<br />
with the constraint of 1 000 household<br />
sampling size and concluded favourably.<br />
Nevertheless, the data used still remain<br />
potentially more robust than many studies<br />
of the same type using routine data and<br />
smaller sample sizes.<br />
Results<br />
The findings relate to the quality of care<br />
at the health facility, including human<br />
resource aspects, and curative, maternal<br />
and children health service utilization. All<br />
results are presented in Table 3.<br />
Quality of care<br />
The three methods have very similar<br />
differences on overall average quality<br />
score impact (DD: 20.2/68, p