

AFRICAN
ahm20
ahm20

Create successful ePaper yourself
Turn your PDF publications into a flip-book with our unique Google optimized e-Paper software.
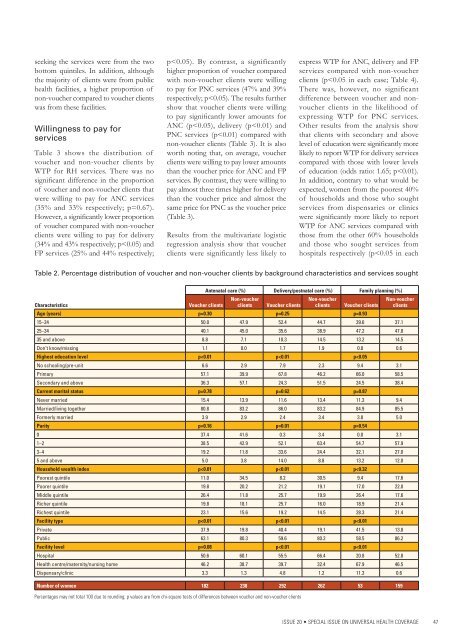
seeking the services were from the two<br />
bottom quintiles. In addition, although<br />
the majority of clients were from public<br />
health facilities, a higher proportion of<br />
non-voucher compared to voucher clients<br />
was from these facilities.<br />
Willingness to pay for<br />
services<br />
Table 3 shows the distribution of<br />
voucher and non-voucher clients by<br />
WTP for RH services. There was no<br />
significant difference in the proportion<br />
of voucher and non-voucher clients that<br />
were willing to pay for ANC services<br />
(35% and 33% respectively; p=0.67).<br />
However, a significantly lower proportion<br />
of voucher compared with non-voucher<br />
clients were willing to pay for delivery<br />
(34% and 43% respectively; p