

AFRICAN
ahm20
ahm20

You also want an ePaper? Increase the reach of your titles
YUMPU automatically turns print PDFs into web optimized ePapers that Google loves.
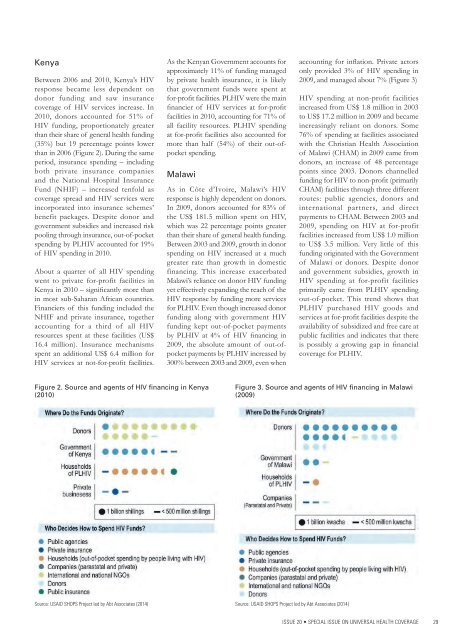
Kenya<br />
Between 2006 and 2010, Kenya’s HIV<br />
response became less dependent on<br />
donor funding and saw insurance<br />
coverage of HIV services increase. In<br />
2010, donors accounted for 51% of<br />
HIV funding, proportionately greater<br />
than their share of general health funding<br />
(35%) but 19 percentage points lower<br />
than in 2006 (Figure 2). During the same<br />
period, insurance spending – including<br />
both private insurance companies<br />
and the National Hospital Insurance<br />
Fund (NHIF) – increased tenfold as<br />
coverage spread and HIV services were<br />
incorporated into insurance schemes’<br />
benefit packages. Despite donor and<br />
government subsidies and increased risk<br />
pooling through insurance, out-of-pocket<br />
spending by PLHIV accounted for 19%<br />
of HIV spending in 2010.<br />
About a quarter of all HIV spending<br />
went to private for-profit facilities in<br />
Kenya in 2010 – significantly more than<br />
in most sub-Saharan African countries.<br />
Financiers of this funding included the<br />
NHIF and private insurance, together<br />
accounting for a third of all HIV<br />
resources spent at these facilities (US$<br />
16.4 million). Insurance mechanisms<br />
spent an additional US$ 6.4 million for<br />
HIV services at not-for-profit facilities.<br />
As the Kenyan Government accounts for<br />
approximately 11% of funding managed<br />
by private health insurance, it is likely<br />
that government funds were spent at<br />
for-profit facilities. PLHIV were the main<br />
financier of HIV services at for-profit<br />
facilities in 2010, accounting for 71% of<br />
all facility resources. PLHIV spending<br />
at for-profit facilities also accounted for<br />
more than half (54%) of their out-ofpocket<br />
spending.<br />
Malawi<br />
As in Côte d’Ivoire, Malawi’s HIV<br />
response is highly dependent on donors.<br />
In 2009, donors accounted for 83% of<br />
the US$ 181.5 million spent on HIV,<br />
which was 22 percentage points greater<br />
than their share of general health funding.<br />
Between 2003 and 2009, growth in donor<br />
spending on HIV increased at a much<br />
greater rate than growth in domestic<br />
financing. This increase exacerbated<br />
Malawi’s reliance on donor HIV funding<br />
yet effectively expanding the reach of the<br />
HIV response by funding more services<br />
for PLHIV. Even though increased donor<br />
funding along with government HIV<br />
funding kept out-of-pocket payments<br />
by PLHIV at 4% of HIV financing in<br />
2009, the absolute amount of out-ofpocket<br />
payments by PLHIV increased by<br />
300% between 2003 and 2009, even when<br />
accounting for inflation. Private actors<br />
only provided 3% of HIV spending in<br />
2009, and managed about 7% (Figure 3)<br />
HIV spending at non-profit facilities<br />
increased from US$ 1.8 million in 2003<br />
to US$ 17.2 million in 2009 and became<br />
increasingly reliant on donors. Some<br />
76% of spending at facilities associated<br />
with the Christian Health Association<br />
of Malawi (CHAM) in 2009 came from<br />
donors, an increase of 48 percentage<br />
points since 2003. Donors channelled<br />
funding for HIV to non-profit (primarily<br />
CHAM) facilities through three different<br />
routes: public agencies, donors and<br />
international partners, and direct<br />
payments to CHAM. Between 2003 and<br />
2009, spending on HIV at for-profit<br />
facilities increased from US$ 1.0 million<br />
to US$ 3.5 million. Very little of this<br />
funding originated with the Government<br />
of Malawi or donors. Despite donor<br />
and government subsidies, growth in<br />
HIV spending at for-profit facilities<br />
primarily came from PLHIV spending<br />
out-of-pocket. This trend shows that<br />
PLHIV purchased HIV goods and<br />
services at for-profit facilities despite the<br />
availability of subsidized and free care at<br />
public facilities and indicates that there<br />
is possibly a growing gap in financial<br />
coverage for PLHIV.<br />
Figure 2. Source and agents of HIV financing in Kenya<br />
(2010)<br />
Figure 3. Source and agents of HIV financing in Malawi<br />
(2009)<br />
Source: USAID SHOPS Project led by Abt Associates (2014)<br />
Source: USAID SHOPS Project led by Abt Associates (2014)<br />
ISSUE 20 • SPECIAL ISSUE ON UNIVERSAL HEALTH COVERAGE 29