

AFRICAN
ahm20
ahm20

You also want an ePaper? Increase the reach of your titles
YUMPU automatically turns print PDFs into web optimized ePapers that Google loves.
WTP data were captured using a<br />
structured questionnaire administered<br />
during exit interviews. Following the<br />
observations described above, clients<br />
were interviewed after consultation<br />
sessions by trained research assistants.<br />
The structured questionnaires used during<br />
the exit interviews captured information<br />
on the clients’ background characteristics<br />
(including age, education level, marital<br />
status and household income);<br />
childbearing experiences and intentions;<br />
perceptions about the services received;<br />
accessibility to the facility (mode and time<br />
of travel); out-of-pocket expenditure and<br />
WTP for the services including a stated<br />
WTP value for the different RH services;<br />
as well as awareness, use and perceptions<br />
about the vouchers. PNC clients were<br />
also asked about their experiences during<br />
delivery.<br />
Written informed consent was obtained<br />
from all participants before conducting<br />
the observations and interviews. The<br />
interviews were conducted in English,<br />
Swahili (the national language) or the<br />
local language depending on which one a<br />
participant was comfortable with. Ethical<br />
approval for the study was obtained from<br />
the Population Council Institutional<br />
Review Board (Protocol No. 470) and<br />
the Kenya Medical Research Institute<br />
(Protocol No. 174).<br />
Analysis<br />
Analysis involved descriptive statistics<br />
(means and percentages) as well as<br />
estimation of multivariate regression<br />
models. We compared the proportions<br />
of voucher and non-voucher clients who<br />
indicated that they were willing to pay for<br />
ANC, delivery, PNC and FP services and<br />
tested whether there were any significant<br />
differences between the two groups. We<br />
further compared the average amount of<br />
money that voucher and non-voucher<br />
clients were willing to pay for the services<br />
and tested whether differences, if any,<br />
were statistically significant. Voucher<br />
clients in this case referred to those who<br />
had ever used FP or safe motherhood<br />
vouchers even if they did not use it on<br />
the day of the interview.<br />
Multivariate regression analysis, on the<br />
other hand, involved estimation of logistic<br />
and ordinary least squares regression<br />
models for the likelihood of WTP and<br />
the amount of money clients were willing<br />
to pay for services respectively. A total of<br />
eight models were estimated. The first<br />
four models examined differences in the<br />
likelihood of WTP for the services (ANC,<br />
delivery, PNC and FP) among voucher<br />
and non-voucher clients. The results are<br />
presented as odds ratios. The next set<br />
of four models examined differences in<br />
the amount voucher and non-voucher<br />
clients were willing to pay for the services.<br />
The results are presented as coefficient<br />
estimates. The models adjusted for<br />
clustering of individuals within the same<br />
facility. The basic form of the model is<br />
given by the following equation:<br />
Y ij = 0 + i X ij + j<br />
where Y ij is the amount paid by individual<br />
i in facility j, 0 is the constant, X ij is<br />
the vector of covariates including the<br />
indicator of whether one was a voucher<br />
client or not, i is the associated vector<br />
of fixed parameters and j is the error<br />
term for individuals identified from the<br />
same facility. The models controlled<br />
for age, highest education level, marital<br />
status at the time of interview, parity,<br />
household wealth index, type and level of<br />
facility. The definitions and measurement<br />
of variables included in the regression<br />
models are presented in Table 1.<br />
Results<br />
Interviews were completed with 419 out<br />
of 432 ANC clients (97%), 554 out of<br />
568 PNC clients (98%) and 212 out of<br />
216 FP clients (98%).<br />
Characteristics of women<br />
Table 2 presents the distribution of ANC,<br />
PNC and FP clients that were successfully<br />
interviewed upon exit by background<br />
characteristics and use of voucher. There<br />
were no significant variations in the<br />
distribution of voucher and non-voucher<br />
clients seeking various services (ANC,<br />
PNC and FP) by age and marital status.<br />
However, voucher and non-voucher<br />
clients seeking ANC and PNC services<br />
significantly differed in terms of highest<br />
level of education, household wealth<br />
status, and the facility from where they<br />
were interviewed. In particular the highest<br />
proportion of voucher clients seeking<br />
ANC and PNC services had primary level<br />
education (57% and 68% respectively).<br />
By contrast, the highest proportion<br />
of non-voucher clients seeking these<br />
services had secondary and above level<br />
of education (57% and 52% respectively).<br />
Similarly, higher proportions of nonvoucher<br />
compared to voucher clients<br />
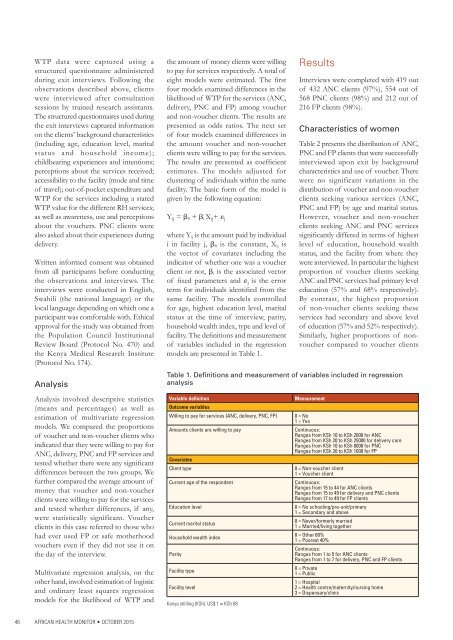
Table 1. Definitions and measurement of variables included in regression<br />
analysis<br />
Variable definition<br />
Outcome variables<br />
Willing to pay for services (ANC, delivery, PNC, FP)<br />
Amounts clients are willing to pay<br />
Covariates<br />
Client type<br />
Current age of the respondent<br />
Education level<br />
Current marital status<br />
Household wealth index<br />
Parity<br />
Facility type<br />
Facility level<br />
Kenya shilling (KSh): US$ 1 ≈ KSh 88<br />
Measurement<br />
0 = No<br />
1 = Yes<br />
Continuous:<br />
Ranges from KSh 10 to KSh 2000 for ANC<br />
Ranges from KSh 20 to KSh 25000 for delivery care<br />
Ranges from KSh 10 to KSh 8000 for PNC<br />
Ranges from KSh 20 to KSh 1000 for FP<br />
0 = Non-voucher client<br />
1 = Voucher client<br />
Continuous:<br />
Ranges from 15 to 44 for ANC clients<br />
Ranges from 15 to 49 for delivery and PNC clients<br />
Ranges from 17 to 49 for FP clients<br />
0 = No schooling/pre-unit/primary<br />
1 = Secondary and above<br />
0 = Never/formerly married<br />
1 = Married/living together<br />
0 = Other 60%<br />
1 = Poorest 40%<br />
Continuous:<br />
Ranges from 1 to 5 for ANC clients<br />
Ranges from 1 to 7 for delivery, PNC and FP clients<br />
0 = Private<br />
1 = Public<br />
1 = Hospital<br />
2 = Health centre/maternity/nursing home<br />
3 = Dispensary/clinic<br />
46<br />
<strong>AFRICAN</strong> HEALTH MONITOR • OCTOBER 2015