HOCHBAHN Annual Report 2015

Create successful ePaper yourself
Turn your PDF publications into a flip-book with our unique Google optimized e-Paper software.
We link up Hamburg | Management | Management <strong>Report</strong> | <strong>Annual</strong> Financial Statements | Further Information<br />
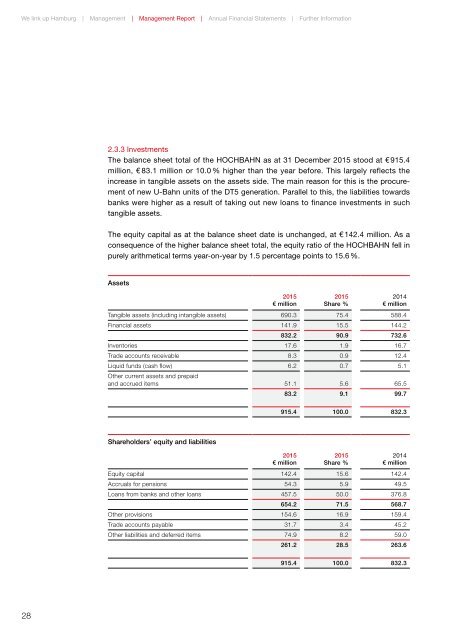
2.3.3 Investments<br />
The balance sheet total of the <strong>HOCHBAHN</strong> as at 31 December <strong>2015</strong> stood at € 915.4<br />
million, € 83.1 million or 10.0 % higher than the year before. This largely reflects the<br />
increase in tangible assets on the assets side. The main reason for this is the procurement<br />
of new U-Bahn units of the DT5 generation. Parallel to this, the liabilities towards<br />
banks were higher as a result of taking out new loans to finance investments in such<br />
tangible assets.<br />
The equity capital as at the balance sheet date is unchanged, at € 142.4 million. As a<br />
consequence of the higher balance sheet total, the equity ratio of the <strong>HOCHBAHN</strong> fell in<br />
purely arithmetical terms year-on-year by 1.5 percentage points to 15.6 %.<br />
Assets<br />
<strong>2015</strong><br />
€ million<br />
<strong>2015</strong><br />
Share %<br />
2014<br />
€ million<br />
Tangible assets (including intangible assets) 690.3 75.4 588.4<br />
Financial assets 141.9 15.5 144.2<br />
832.2 90.9 732.6<br />
Inventories 17.6 1.9 16.7<br />
Trade accounts receivable 8.3 0.9 12.4<br />
Liquid funds (cash flow) 6.2 0.7 5.1<br />
Other current assets and prepaid<br />
and accrued items 51.1 5.6 65.5<br />
83.2 9.1 99.7<br />
915.4 100.0 832.3<br />
Shareholders’ equity and liabilities<br />
<strong>2015</strong><br />
€ million<br />
<strong>2015</strong><br />
Share %<br />
2014<br />
€ million<br />
Equity capital 142.4 15.6 142.4<br />
Accruals for pensions 54.3 5.9 49.5<br />
Loans from banks and other loans 457.5 50.0 376.8<br />
654.2 71.5 568.7<br />
Other provisions 154.6 16.9 159.4<br />
Trade accounts payable 31.7 3.4 45.2<br />
Other liabilities and deferred items 74.9 8.2 59.0<br />
261.2 28.5 263.6<br />
915.4 100.0 832.3<br />
28