
Create successful ePaper yourself
Turn your PDF publications into a flip-book with our unique Google optimized e-Paper software.
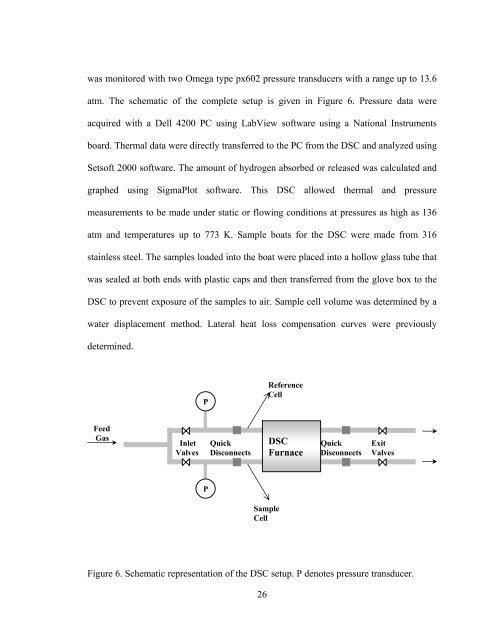
was monitored with two Omega type px602 pressure transducers with a range up to 13.6<br />
atm. The schematic of the complete setup is given in Figure 6. Pressure data were<br />
acquired with a Dell 4200 PC using LabView software using a National Instruments<br />
board. Thermal data were directly transferred to the PC from the DSC and analyzed using<br />
Setsoft 2000 software. The amount of hydrogen absorbed or released was calculated and<br />
graphed using SigmaPlot software. This DSC allowed thermal and pressure<br />
measurements to be made under static or flowing conditions at pressures as high as 136<br />
atm and temperatures up to 773 K. Sample boats for the DSC were made from 316<br />
stainless steel. The samples loaded into the boat were placed into a hollow glass tube that<br />
was sealed at both ends with plastic caps and then transferred from the glove box to the<br />
DSC to prevent exposure of the samples to air. Sample cell volume was determined by a<br />
water displacement method. Lateral heat loss compensation curves were previously<br />
determined.<br />
P<br />
Reference<br />
Cell<br />
Feed<br />
Gas<br />
Inlet<br />
Valves<br />
Quick<br />
Disconnects<br />
DSC<br />
Furnace<br />
Quick<br />
Disconnects<br />
Exit<br />
Valves<br />
P<br />
Sample<br />
Cell<br />
Figure 6. Schematic representation of the DSC setup. P denotes pressure transducer.<br />
26