
Create successful ePaper yourself
Turn your PDF publications into a flip-book with our unique Google optimized e-Paper software.
GC output, arbitrary units<br />
0 5 10 15 20 25 30 35<br />
sampling time (min)<br />
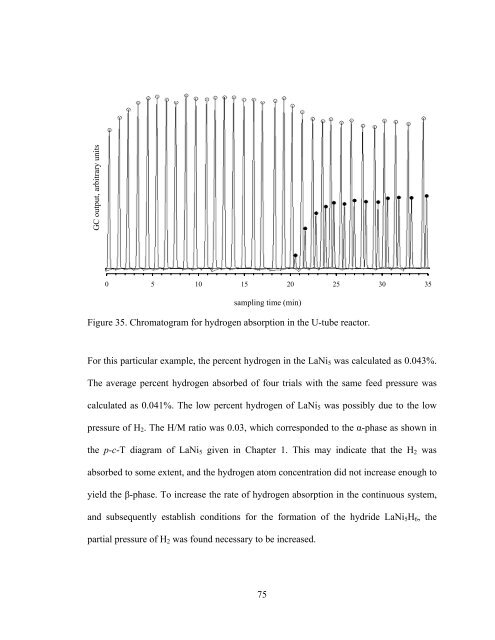
Figure 35. Chromatogram for hydrogen absorption in the U-tube reactor.<br />
For this particular example, the percent hydrogen in the LaNi 5 was calculated as 0.043%.<br />
The average percent hydrogen absorbed of four trials with the same feed pressure was<br />
calculated as 0.041%. The low percent hydrogen of LaNi 5 was possibly due to the low<br />
pressure of H 2 . The H/M ratio was 0.03, which corresponded to the α-phase as shown in<br />
the p-c-T diagram of LaNi 5 given in Chapter 1. This may indicate that the H 2 was<br />
absorbed to some extent, and the hydrogen atom concentration did not increase enough to<br />
yield the β-phase. To increase the rate of hydrogen absorption in the continuous system,<br />
and subsequently establish conditions for the formation of the hydride LaNi 5 H 6 , the<br />
partial pressure of H 2 was found necessary to be increased.<br />
75