
Create successful ePaper yourself
Turn your PDF publications into a flip-book with our unique Google optimized e-Paper software.
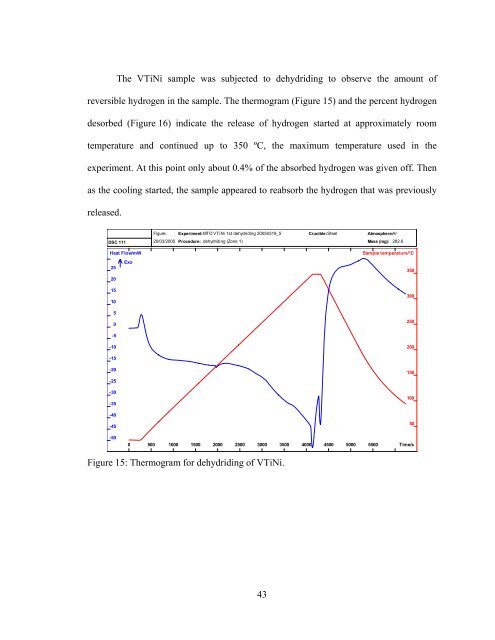
The VTiNi sample was subjected to dehydriding to observe the amount of<br />
reversible hydrogen in the sample. The thermogram (Figure 15) and the percent hydrogen<br />
desorbed (Figure 16) indicate the release of hydrogen started at approximately room<br />
temperature and continued up to 350 ºC, the maximum temperature used in the<br />
experiment. At this point only about 0.4% of the absorbed hydrogen was given off. Then<br />
as the cooling started, the sample appeared to reabsorb the hydrogen that was previously<br />
released.<br />
DSC 111<br />
Heat Flow/mW<br />
Exo<br />
25<br />
20<br />
15<br />
10<br />
5<br />
0<br />
Figure: Experiment:MTO VTiNi 1st dehydriding 20050319_5<br />
Crucible:Steel<br />
Atmosphere:Ar<br />
20/03/2005 Procedure: dehydriding (Zone 1)<br />
Mass (mg): 282.6<br />
Sample temperature/°C<br />
350<br />
300<br />
250<br />
-5<br />
-10<br />
200<br />
-15<br />
-20<br />
-25<br />
-30<br />
-35<br />
-40<br />
-45<br />
-50<br />
0 500 1000 1500 2000 2500 3000 3500 4000 4500 5000 5500<br />
150<br />
100<br />
50<br />
Time/s<br />
Figure 15: Thermogram for dehydriding of VTiNi.<br />
43