- Page 1 and 2:
CONSERVATION, CHARACTERISATION AND
- Page 3 and 4:
L’objectif final du projet europ
- Page 5 and 6:
MATERIALS AND METHODS: WP1: Molecul
- Page 7 and 8:
Table 2. Accessions described by ea
- Page 9 and 10:
frequently 9/9) (Fig. 1). For anoth
- Page 11 and 12:
European database improvement and e
- Page 13 and 14:
Cornea V., Hausman J.-F., Gasparian
- Page 15 and 16:
génétique chez la vigne sauvage (
- Page 17 and 18:
Fig. 1 Haplotype network derived fr
- Page 19 and 20:
Sequence group ATT Sequence group G
- Page 21 and 22:
Lefort F, Roubelakis-Angelakis K (2
- Page 23 and 24:
Georgia are thought to be the most
- Page 25 and 26:
Tab. 2 - SSR analysis results. prov
- Page 27 and 28:
0.13 0.82 genetic similarity coeffi
- Page 29 and 30:
ACKNOWLEDGMENTS The authors thank V
- Page 31 and 32:
century new bred varieties enriched
- Page 33 and 34:
offspring (PO). For each of these k
- Page 35 and 36:
This result is quite interesting be
- Page 37 and 38:
Law, 1998. Law of Georgia on Vine a
- Page 39 and 40:
to these regions to collect and stu
- Page 41 and 42:
In view of the above we can make th
- Page 43 and 44:
tenz gegenüber der Reblaus demonst
- Page 45 and 46:
columns 6 to 8 obviously do not car
- Page 47 and 48:
Zhang,J.K.; Hausmann,L.; Eibach,R.;
- Page 49 and 50:
Introduction Phylloxera was found i
- Page 51 and 52:
BerlandieriXRiparia Teleki 8 b Vazi
- Page 53 and 54:
Distribution of phylloxera resistan
- Page 55 and 56:
Conclusion It is clear from above r
- Page 57 and 58:
L’ESPOIR INDIGENE DES VARIETES DE
- Page 59 and 60:
Grape growing has to adapt somehow
- Page 61 and 62:
The vineyard was established in 200
- Page 63 and 64:
CONCLUSIONS From the experiments co
- Page 65 and 66:
Introduction In a previous paper pr
- Page 67 and 68:
ange of plants and their pests and
- Page 69 and 70:
a scheme. While a compromise scheme
- Page 71 and 72:
pilot phase, SWNZ was adopted comme
- Page 73 and 74:
References Aurambout, J.-P., Consta
- Page 75 and 76:
The present work is dedicated to th
- Page 77 and 78:
Figure 2. Induction straight lines
- Page 79 and 80:
EVOLUTION DU CLIMAT ET VITICULTURE
- Page 81 and 82:
I. Principaux effets perçus Physio
- Page 83 and 84:
climatiques difficiles à quantifie
- Page 85 and 86:
RISK OF CLIMATE CHANGE FOR GRAPEVIN
- Page 87 and 88:
agricultural insurance programmes o
- Page 89 and 90:
Figure 2. Future climate scenarios
- Page 91 and 92:
Climatic variability and Agricultur
- Page 93 and 94:
Climate Change and Viticulture - Fa
- Page 95 and 96:
Carbon and water footprint of the w
- Page 97 and 98:
SYSTÈMES DE PRODUCTION INNOVANTS E
- Page 99 and 100:
de Fraîcheur des nuits), avec éve
- Page 101 and 102:
(vendange mécanique), apporte un g
- Page 103 and 104:
grape berry sugar loading Figure 4.
- Page 105 and 106:
BUD DORMANCY RELEASE INDUCTION IN R
- Page 107 and 108:
unknown. However, progress has been
- Page 109 and 110:
Table 2. Average number of bunches
- Page 111 and 112:
eaking. In this case, the adjuvants
- Page 113 and 114:
ROLE OF ARTIFICIAL MYCORRHIZATION O
- Page 115 and 116:
Tab.2. Correlation coefficients (
- Page 117 and 118:
FIELD TRIALS ON NEUTRAL SOIL Two fi
- Page 119 and 120:
Bavaresco L., Fregoni M., Fraschini
- Page 121 and 122:
INTRODUZIONE Il suolo e le sue prop
- Page 123 and 124:
Tab.1 Caratteristiche pedologiche d
- Page 125 and 126:
Fig. 3 Densità e distribuzione deg
- Page 127 and 128:
Tab.2 Parametri produttivi e qualit
- Page 129 and 130:
PRESENZA DI UOVA DI SCAPHOIDEUS TIT
- Page 131 and 132:
camera termostatata dal 20 marzo al
- Page 133 and 134:
Dalle analisi effettuate sul legno
- Page 135 and 136:
idosso dei terreni adibiti a nuovi
- Page 137 and 138:
LA REGLEMENTATION DE LA RECOLTE DU
- Page 139 and 140:
Le climat : le climat de la zone va
- Page 141 and 142:
Il est présenté la formation de l
- Page 143 and 144:
BIBLIOGRAPHIE 1. ADLER JU.P., E.B.
- Page 145 and 146:
della radice, spara peso e l'età d
- Page 147 and 148:
In the study, parameters suggesting
- Page 149 and 150:
In the study, it is determined that
- Page 151 and 152:
WEINBAU UND ENERGIE H.-P. Schwarz F
- Page 153 and 154:
enötigte Energie beträgt 0,68 kWh
- Page 155 and 156:
„Der geothermische Wärmestrom du
- Page 157 and 158:
Conservación de las uvas Centennia
- Page 159 and 160:
Para la variedad Centennial Seedles
- Page 161 and 162:
Fig.1. Efectos de la aplicación de
- Page 163 and 164:
CENCI (1994), estudiando tratamient
- Page 165 and 166:
Evaluation of Rheological and Senso
- Page 167 and 168:
L’IDENTIFICAZIONE DEI SISTEMI AZI
- Page 169 and 170:
asate sulla valutazione dei risulta
- Page 171 and 172:
In relazione alla dimensione fisica
- Page 173 and 174:
Tab. 3 - Aziende con ordinamento pr
- Page 175 and 176:
Traditional technologies and histor
- Page 177 and 178:
led the Christianity into Georgia a
- Page 179 and 180:
The high level folk selection proce
- Page 181 and 182:
high quality, diverse wine making t
- Page 183 and 184:
In questi ultimi anni, si sta cerca
- Page 185 and 186:
Tabella 3 : Parametri relativi ai c
- Page 187 and 188:
linalolo 338,2 387,6 367,1 392,1 28
- Page 189 and 190:
lumenol C 88.5 91.8 81.0 107.6 151.
- Page 191 and 192:
Sulla base di queste premesse si è
- Page 193 and 194:
� Lattoni: � il γ-nonalattone,
- Page 195 and 196:
macerato è stata proprio l’origi
- Page 197 and 198:
VINI TESTIMONE MACERAZIONI LUNGHE S
- Page 199 and 200:
BIBLIOGRAFIA Fedrizzi B., Versini G
- Page 201 and 202:
Introduction Polyphenols of red win
- Page 203 and 204:
Figure 1. The total of common pheno
- Page 205 and 206:
higher than that of (+)-catechin. C
- Page 207 and 208:
11. Knekt P, Isotupa S, Rissanen H,
- Page 209 and 210:
autolysates and preparations on the
- Page 211 and 212:
yeast mass was processed on our new
- Page 213 and 214:
INTRODUCTION La construction d’un
- Page 215 and 216:
4 plutôt qu'à incandescence perme
- Page 217 and 218:
6 Figure 4 : Carte des ressources g
- Page 219 and 220:
CONCLUSION Au cours du XXIème siè
- Page 221 and 222:
Knowledge of the geographical origi
- Page 223 and 224:
The values 18 O/ 16 O of wine water
- Page 225 and 226:
whose average content was 74.0 mg.L
- Page 227 and 228:
Martin ML, Mazure M, Jouitteau; Mar
- Page 229 and 230:
MATERIALS AND METHODS The study was
- Page 231 and 232:
Figure 2 : PCA representation of th
- Page 233 and 234:
The vintage effect on anthocyanins
- Page 235 and 236:
Gawel R, Francis L, Waters EJ (2007
- Page 237 and 238:
foodstuffs.Apple and citruc’ pect
- Page 239 and 240:
Fig.2. dynamics is the content of p
- Page 241 and 242:
Because of to their the complex- fo
- Page 243 and 244:
of fermentation substrate (Scanec,
- Page 245 and 246:
Student's t test were used to deter
- Page 247 and 248:
of ATP, maintaining favourable redo
- Page 249 and 250:
kinetics of two endogenic wine yeas
- Page 251 and 252:
manière excessive. L’évolution
- Page 253 and 254:
démarrage de Fermentation MaloLact
- Page 255 and 256:
constitué positivement des attribu
- Page 257 and 258:
D’une façon générale, comme po
- Page 259 and 260:
the risks related to the consumptio
- Page 261 and 262:
Total polyphenols, expressed as Fol
- Page 263 and 264:
In order to better understand the e
- Page 265 and 266:
GENETICALLY MODIFIED WINE YEASTS: A
- Page 267 and 268:
Gm strain ML01 (degradation of mali
- Page 269 and 270:
strains were released at several ti
- Page 271 and 272:
of the experimental vineyard. Big d
- Page 273 and 274:
Gonzalez-Candelas L, Gil JV, Lamuel
- Page 275 and 276:
INTRODUCTION Secondary alcoholic fe
- Page 277 and 278:
major, secondary and side products
- Page 279 and 280:
Kirtadze E., Kvesitadze G. 2008. Ye
- Page 281 and 282:
degradar simultáneamente más de u
- Page 283 and 284:
Se han seleccionado un total de 85
- Page 285 and 286:
a un control, en el que el extracto
- Page 287 and 288:
USO DE UN NUEVO SISTEMA DE INMOVILI
- Page 289 and 290:
nivel de azúcar reductor inicial d
- Page 291 and 292:
Análisis de parámetros enológico
- Page 293 and 294:
CONCLUSIONES Este estudio describe
- Page 295 and 296:
Influence of grape variety and the
- Page 297 and 298:
using a commercial kit. The isolate
- Page 299 and 300:
Table 4. Distribution of the global
- Page 301 and 302:
Table 6. Distribution of yeast spec
- Page 303 and 304:
ULTRAVIOLET LIGHT (UV-C) IRRADIATIO
- Page 305 and 306:
MATERIALS AND METHODS UV-C system i
- Page 307 and 308:
After the treatment, AAB isolates c
- Page 309 and 310:
Mills D.A., Phister T., Neeley E.,
- Page 311 and 312:
Méthodes d’analyse en Œnologie.
- Page 313 and 314:
détermination des caractéristique
- Page 315 and 316:
aplicação das práticas enológic
- Page 317 and 318:
INTRODUCTION Bacteria in grape must
- Page 319 and 320:
RESULTS AND DISCUSSION ELISA qualit
- Page 321 and 322: ABSTRACT NEW APPROACH FOR IDENTIFIC
- Page 323 and 324: HPLC conditions Column - LiChroCart
- Page 325 and 326: Some wines produced from other Geor
- Page 327 and 328: BIBLIOGRAPHY [1] Eder R., 2002. Suc
- Page 329 and 330: INTRODUCTION La présence dans les
- Page 331 and 332: (splitless) est de 250 °C. Une col
- Page 333 and 334: mais a un niveau inférieur à la l
- Page 335 and 336: D’autre part, les résultats obte
- Page 337 and 338: INTRODUCTION En un mundo cada vez m
- Page 339 and 340: usados en el comercio. Son ejemplos
- Page 341 and 342: Actualmente, en relación al proces
- Page 343 and 344: hecho, el crecimiento del número d
- Page 345 and 346: Country-of-Origin-Effects des georg
- Page 347 and 348: In der Studie von Veale et al. (200
- Page 349 and 350: auf die wahrgenommene Produktbewert
- Page 351 and 352: Dimensionen im Hinblick auf die zug
- Page 353 and 354: 9 H4d Urlaubsland Soziale Akzeptanz
- Page 355 and 356: Balestrini, P., Gamble, P., 2006: C
- Page 357 and 358: Sauer, P.L., Young, M.A., Unnava, R
- Page 359 and 360: 15 Tab. 3: Faktorladungsmatrix zur
- Page 361 and 362: Finally, it was possible to identif
- Page 363 and 364: The results in the two periods were
- Page 365 and 366: 4. From expectations to consumer re
- Page 367 and 368: Precise, reliable technical informa
- Page 369 and 370: INTRODUCTION Over the last 10 to 15
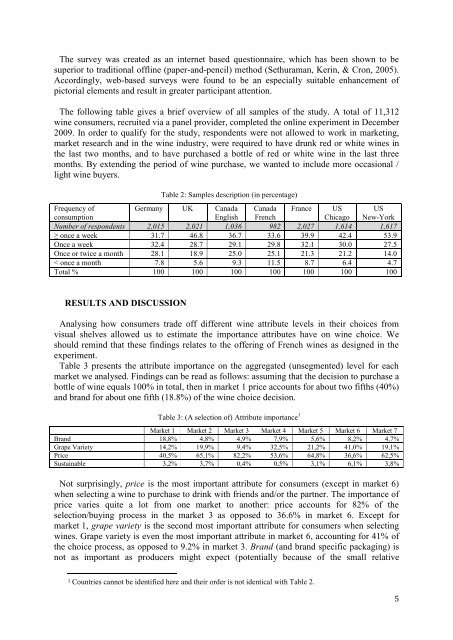
- Page 371: egards to the region, we selected P
- Page 375 and 376: into the relative monetary valuatio
- Page 377 and 378: wird der Schwerpunkt auf der Präse
- Page 379 and 380: Becoming more cautious regarding en
- Page 381 and 382: Results and Discussions According t
- Page 383 and 384: Bibliography A. Heijbroek (2003) Co
- Page 385 and 386: ed attività più interdisciplinare
- Page 387 and 388: Table A: 1- PRODUCTION (A- t /104 m
- Page 389 and 390: ha fornito il minor (molto negativo
- Page 391 and 392: CARGNELLO G. (2008d): Nuove innovat
- Page 393 and 394: Si tratta di un progetto dedicato a
- Page 395 and 396: A4 Analisi delle priorità sugli ar
- Page 397 and 398: F2 Ampiezza dell’organizzazione d
- Page 399 and 400: microimprese. Le aziende più grand
- Page 401 and 402: Una vista a la economía del país
- Page 403 and 404: Distribución del Valor Bruto de Pr
- Page 405 and 406: En este sentido, se define al Patri
- Page 407 and 408: conserva núcleos de vivienda - rec
- Page 409 and 410: Ilustración 2. Cava de la Bodega J
- Page 411 and 412: DAS VERBOT EINES GUTEN ÖNOLOGISCHE
- Page 413 and 414: Was die chemische Zusammensetzung u
- Page 415 and 416: SCHLUSSFOLGERUNGEN Die Einführung
- Page 417 and 418: 29 Maier, K. 1875. Die Ausbrüche,
- Page 419 and 420: INTRODUCTION: WHAT IS ORGANIC WINE?
- Page 421 and 422: In North America, all the major gro
- Page 423 and 424:
BARRIERS TO ORGANIC TRADE The Organ
- Page 425 and 426:
In the United States, ‘organic pr
- Page 427 and 428:
ANNEX 1: CERTIFICATION AND LABELLIN
- Page 429 and 430:
The USDA’s strict labelling rules
- Page 431 and 432:
Demeter is an organisation which pr
- Page 433 and 434:
There are currently six organic cer
- Page 435 and 436:
Manure restrictions Requires minimu
- Page 437 and 438:
Coles Official Website 2010, Access
- Page 439 and 440:
http://www.afrisco.net/ Argencert I
- Page 441 and 442:
Official Journal of the European Un
- Page 443 and 444:
ARTICULER LES QUALITES ENVIRONNEMEN
- Page 445 and 446:
INTRODUCTION En matière d’enviro
- Page 447 and 448:
20000 18000 16000 14000 12000 10000
- Page 449 and 450:
« Face au biologique intensif et i
- Page 451 and 452:
plus, afin de devenir le standard d
- Page 453 and 454:
Les sciences du goût procèdent au
- Page 455 and 456:
aisonnée, que du bio ou de la biod
- Page 457 and 458:
Verbrauchereinstellungen zu Biowein
- Page 459 and 460:
Weintrinker, die nur 8 % der erwach
- Page 461 and 462:
vor allem den Unterschied zwischen
- Page 463 and 464:
Abb. 5: Nutzung der Einkaufsstätte
- Page 465 and 466:
markant von denjenigen Weinen unter
- Page 467 and 468:
corresponding demand price elastici
- Page 469 and 470:
Where corresponds to the product of
- Page 471 and 472:
4.1 Estimated Parameters and Elasti
- Page 473 and 474:
Huang, C., 1996. “Consumer prefer
- Page 475 and 476:
2 Absatzerfolgen hat alkoholfreies
- Page 477 and 478:
4 worden. Gleichzeitig wurde aus Gr
- Page 479 and 480:
6 Aromen als zulässig angesehen we
- Page 481 and 482:
8 4. „Schäumendes Getränk aus a
- Page 483 and 484:
differenti paesi e per diverse cate
- Page 485 and 486:
stessa viene percepita, ma, a parit
- Page 487 and 488:
queste vengono incluse le lunghe e
- Page 489 and 490:
Lockie S., Lawrence G., Lyons K., G
- Page 491 and 492:
useful chemical properties. They ar
- Page 493 and 494:
Destruction of polymers begins afte
- Page 495 and 496:
We started to study stilbens in 199
- Page 497 and 498:
Experimental (+0.1 gr/l reseveratro
- Page 499 and 500:
7. Bezhuashvili M., Месхи М.,
- Page 501 and 502:
Production of Non-alcoholic and Low
- Page 503 and 504:
chromatograph. Concentration of min
- Page 505 and 506:
Figure 2. The Total Concentration o
- Page 507 and 508:
Patrimoine, santé, environnement :
- Page 509 and 510:
milliards d'euros en 2006 dont 158
- Page 511 and 512:
Traditionnel et peu porté par des
- Page 513 and 514:
La valeur patrimoniale et tradition
- Page 515 and 516:
undesirable substances such as prot
- Page 517 and 518:
1 2 EW1 EW2 Egg LY OV EW2 Egg LY OV
- Page 519 and 520:
Same experimental samples were prep


