Table of contents
MyBucks%20Annual%20Report%202016
MyBucks%20Annual%20Report%202016
You also want an ePaper? Increase the reach of your titles
YUMPU automatically turns print PDFs into web optimized ePapers that Google loves.
30 June 2016<br />
Neither past<br />
due nor<br />
specifically<br />
impaired<br />
Past due<br />
specifically.<br />
impaired<br />
Total gross<br />
advances to<br />
customers<br />
Less:<br />
Impairment<br />
Net advances<br />
to customers<br />
30 June 2016<br />
€ € € € €<br />
Botswana loan book 5 591 715 1 274 727 6 866 442 (638 774) 6 227 668<br />
Malawi loan book 3 322 387 1 044 733 4 367 120 (360 244) 4 006 876<br />
Zimbabwe loan book 8 701 191 1 332 274 10 033 465 (841 416) 9 192 049<br />
Kenya loan book 2 925 923 2 931 661 5 857 584 (1 477 215) 4 380 369<br />
Zambia loan book 5 903 766 1 500 634 7 404 400 (601 604) 6 802 796<br />
Spain loan book 127 189 4 025 379 4 152 568 (2 946 947) 1 205 621<br />
Other subsidiary loan books 705 557 762 470 1 468 027 (339 788) 1 128 239<br />
South Africa loan book 5 375 110 7 184 680 12 559 790 (4 302 462) 8 257 328<br />
Total loan book 32 652 838 20 056 558 52 709 396 (11 508 450) 41 200 946<br />
30 June 2015<br />
Neither past<br />
due nor<br />
specifically<br />
impaired<br />
Past due<br />
specifically<br />
impaired<br />
Total gross<br />
advances to<br />
customers<br />
Less:<br />
Impairment<br />
Net advances<br />
to customers<br />
30 June 2015<br />
€ € € € €<br />
Botswana loan book 5 145 491 1 479 273 6 624 764 (1 059 839) 5 564 925<br />
Malawi loan book 3 929 111 1 321 324 5 250 435 (217 569) 5 032 866<br />
Zimbabwe loan book 7 502 456 682 845 8 185 301 (389 116) 7 796 185<br />
Kenya loan book 3 400 359 2 271 043 5 671 402 (1 310 608) 4 360 794<br />
Zambia loan book 1 756 239 104 015 1 860 254 (38 743) 1 821 511<br />
Spain loan book 476 296 1 274 505 1 750 801 (609 785) 1 141 016<br />
Other subsidiary loan books 526 860 58 227 585 087 (77 586) 507 501<br />
South Africa loan book 8 470 719 3 396 381 11 867 100 (1 892 771) 9 974 329<br />
Total loan book 31 207 531 10 587 613 41 795 144 (5 596 017) 36 199 127<br />
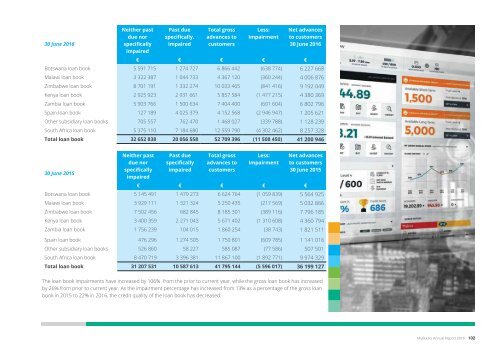
The loan book impairments have increased by 106% from the prior to current year, while the gross loan book has increased<br />
by 26% from prior to current year. As the impairment percentage has increased from 13% as a percentage <strong>of</strong> the gross loan<br />
book in 2015 to 22% in 2016, the credit quality <strong>of</strong> the loan book has decreased.<br />
Credit risk impacts<br />
The table below lists risks raised in this note, along with the anticipated impact on pr<strong>of</strong>it or loss should the risks crystallise.<br />
Effects <strong>of</strong> increase in emergence period by 1 month 2016<br />
€<br />
2015<br />
€<br />
Increase in Botswana provision 24 755 29 774<br />
Increase in Malawi provision 2 975 4 485<br />
Increase in Zimbabwe provision 276 18 825<br />
Increase in Kenya provision 4 564 29 838<br />
Increase in Zambia provision 21 588 914<br />
Increase in Spain provision 5 981 25 990<br />
Increase in Other provision 13 317 1 608<br />
Increase in South African provision 87 280 578 188<br />
Effects <strong>of</strong> increase in loss ratio by % <strong>of</strong> portfolio<br />
provision<br />
160 736 689 622<br />
2016<br />
€<br />
2015<br />
€<br />
Increase in Botswana provision - 5% 168 731 53 933<br />
Increase in Malawi provision - 5% 39 914 11 392<br />
Increase in Zimbabwe provision - 5% 25 773 20 083<br />
Increase in Kenya provision - 5% 50 157 68 096<br />
Increase in Zambia provision - 5% 312 982 8 118<br />
Increase in Spain provision - 5% 205 172 15 726<br />
Increase in Other provision - 5% 14 969 8 487<br />
Increase in South African provision - 1% 119 265 118 302<br />
936 963 304 137<br />
A 1% increase is applied in the South African Group as the South African provisioning methodology differs to that <strong>of</strong> the rest<br />
<strong>of</strong> the major entities within the Group, which are based on a deduction at source lending model. The South African lending<br />
model is more sensitive to fluctuations since it primarily uses a direct lending model.<br />
| Introduction | Business Overview | Corporate Governance | Financial Statements | Other |<br />
MyBucks Annual Report 2016 102<br />
103 MyBucks Annual Report 2016


