

Table of contents
MyBucks%20Annual%20Report%202016
MyBucks%20Annual%20Report%202016

Create successful ePaper yourself
Turn your PDF publications into a flip-book with our unique Google optimized e-Paper software.
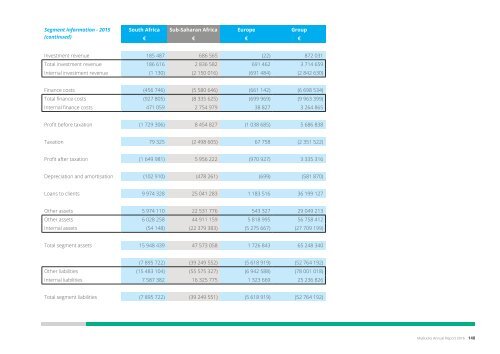
Segment information - 2015<br />
(continued)<br />
South Africa Sub-Saharan Africa Europe Group<br />
€ € € €<br />
Investment revenue 185 487 686 565 (22) 872 031<br />
Total investment revenue 186 616 2 836 582 691 462 3 714 659<br />
Internal investment revenue (1 130) (2 150 016) (691 484) (2 842 630)<br />
Finance costs (456 746) (5 580 646) (661 142) (6 698 534)<br />
Total finance costs (927 805) (8 335 625) (699 969) (9 963 399)<br />
Internal finance costs 471 059 2 754 979 38 827 3 264 865<br />
Pr<strong>of</strong>it before taxation (1 729 306) 8 454 827 (1 038 685) 5 686 838<br />
Taxation 79 325 (2 498 605) 67 758 (2 351 522)<br />
Pr<strong>of</strong>it after taxation (1 649 981) 5 956 222 (970 927) 3 335 316<br />
Depreciation and amortisation (102 910) (478 261) (699) (581 870)<br />
Loans to clients 9 974 328 25 041 283 1 183 516 36 199 127<br />
Other assets 5 974 110 22 531 776 543 327 29 049 213<br />
Other assets 6 028 258 44 911 159 5 818 995 56 758 412<br />
Internal assets (54 148) (22 379 383) (5 275 667) (27 709 199)<br />
Total segment assets 15 948 439 47 573 058 1 726 843 65 248 340<br />
(7 895 722) (39 249 552) (5 618 919) (52 764 192)<br />
Other liabilities (15 483 104) (55 575 327) (6 942 588) (78 001 018)<br />
Internal liabilities 7 587 382 16 325 775 1 323 669 25 236 826<br />
Total segment liabilities (7 895 722) (39 249 551) (5 618 919) (52 764 192)<br />
42. Related parties<br />
Relationships<br />
Subsidiaries Holding % 2016<br />
GetBucks Limited (Mauritius) 100.0%<br />
GetBucks (Proprietary) Limited (South Africa) 100.0%<br />
GetBucks (Proprietary) Limited (Botswana) 100.0%<br />
BU Bucks (Proprietary) Limited (Botswana) 85.0%<br />
CashCorp (Proprietary) Limited (Botswana) 100.0%<br />
TU Loans (Proprietary) Limited (Botswana) 85.0%<br />
GetBucks Financial Services (Private) Limited (Zimbabwe) 50.3%<br />
GetBucks Limited (Malawi) 99.0%<br />
EMU-INYA Enterprises Limited (Kenya) 100.0%<br />
GetSure Botswana (Proprietary) Limited (Botswana) 100.0%<br />
GetBucks Invest GmbH (Austria) 100.0%<br />
GetBucks Spain SL (Spain) 95.0%<br />
GetBucks Poland SP z.o.o (Poland) 100.0%<br />
GetBucks Financial Services Limited (Zambia) 100.0%<br />
Ligagu Investments (Proprietary) Limited (Swaziland) 49.0%<br />
GetBucks (Proprietary) Limited (Namibia) 100.0%<br />
GetBucks Limited (Ghana) 60.0%<br />
GetBucks Limited (Uganda) 100.0%<br />
GetBucks Equatorial Guinea Limited (Equatorial Guinea) 51.0%<br />
VSS Financial Services (Proprietary) Limited (South Africa) 100.0%<br />
GetSure (Proprietary) Limited (South Africa) 100.0%<br />
Sanceda Recoveries (Proprietary) Limited 100.0%<br />
Alto Legal (Proprietary) Limited (Botswana) 100.0%<br />
Alto Assurance (Proprietary) Limited (Botswana) 100.0%<br />
Ochwe Properties (Proprietary) Limited (Botswana) 50.0%<br />
GetBucks (Proprietary) Limited (Swaziland) 51.0%<br />
GetSure Life Limited (South Africa) 100.0%<br />
Subsidiaries Holding % 2016<br />
GS Insurance Limited (Namibia) 95.0%<br />
GetSure Holdings Botswana (Proprietary) Limited (Botswana) 100.0%<br />
| Introduction | Business Overview | Corporate Governance | Financial Statements | Other |<br />
MyBucks Annual Report 2016 140<br />
141 MyBucks Annual Report 2016