

Table of contents
MyBucks%20Annual%20Report%202016
MyBucks%20Annual%20Report%202016

Create successful ePaper yourself
Turn your PDF publications into a flip-book with our unique Google optimized e-Paper software.
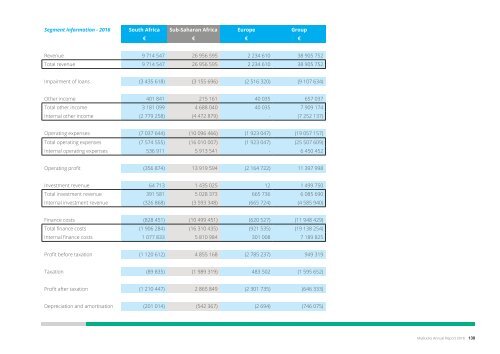
Segment information - 2016 South Africa Sub-Saharan Africa Europe Group<br />
€ € € €<br />
Revenue 9 714 547 26 956 595 2 234 610 38 905 752<br />
Total revenue 9 714 547 26 956 595 2 234 610 38 905 752<br />
Impairment <strong>of</strong> loans (3 435 618) (3 155 696) (2 516 320) (9 107 634)<br />
Other income 401 841 215 161 40 035 657 037<br />
Total other income 3 181 099 4 688 040 40 035 7 909 174<br />
Internal other income (2 779 258) (4 472 879) - (7 252 137)<br />
Operating expenses (7 037 644) (10 096 466) (1 923 047) (19 057 157)<br />
Total operating expenses (7 574 555) (16 010 007) (1 923 047) (25 507 609)<br />
Internal operating expenses 536 911 5 913 541 - 6 450 452<br />
Operating pr<strong>of</strong>it (356 874) 13 919 594 (2 164 722) 11 397 998<br />
Investment revenue 64 713 1 435 025 12 1 499 750<br />
Total investment revenue 391 581 5 028 373 665 736 6 085 690<br />
Internal investment revenue (326 868) (3 593 348) (665 724) (4 585 940)<br />
Finance costs (828 451) (10 499 451) (620 527) (11 948 429)<br />
Total finance costs (1 906 284) (16 310 435) (921 535) (19 138 254)<br />
Internal finance costs 1 077 833 5 810 984 301 008 7 189 825<br />
Pr<strong>of</strong>it before taxation (1 120 612) 4 855 168 (2 785 237) 949 319<br />
Taxation (89 835) (1 989 319) 483 502 (1 595 652)<br />
Pr<strong>of</strong>it after taxation (1 210 447) 2 865 849 (2 301 735) (646 333)<br />
Depreciation and amortisation (201 014) (542 367) (2 694) (746 075)<br />
Loans to clients 8 257 328 31 674 667 1 268 951 41 200 946<br />
Other assets 4 679 405 29 424 635 13 098 696 47 202 736<br />
Other assets 8 515 257 62 734 832 109 389 314 180 639 403<br />
Internal assets (3 835 852) (33 310 197) (96 290 618) (133 436 667)<br />
Total segment assets 12 936 733 61 099 302 14 367 647 88 403 682<br />
7 704 278 53 499 348 7 710 355 68 913 981<br />
Other liabilities 16 285 559 78 854 0542 14 600 950 109 740 563<br />
Internal liabilities (8 581 281) (25 354 704) (6 890 595) (40 826 580)<br />
Total segment liabilities 7 704 278 53 499 348 7 710 355 68 913 981<br />
Segment information - 2015 South Africa Sub-Saharan Africa Europe Group<br />
€ € € €<br />
Revenue 8 875 081 21 416 555 999 211 31 290 847<br />
Total revenue 8 875 081 21 416 555 1 025 522 31 317 158<br />
Internal revenue - - (26 311) (26 311)<br />
Impairment <strong>of</strong> loans (4 446 128) (1 748 951) (618 896) (6 813 975)<br />
Other income 266 525 126 122 13 840 406 487<br />
Total other income 2 045 955 3 642 550 13 840 5 702 345<br />
Internal other income (1 779 430) (3 516 428) - (5 295 858)<br />
Operating expenses (6 153 524) (6 444 817) (771 677) (13 370 018)<br />
Total operational expenses (6 153 524) (12 919 486) (796 145) (19 869 155)<br />
Internal operational expenses - 6 474 669 24 468 6 499 137<br />
Operating pr<strong>of</strong>it (1 458 046) 13 348 909 (377 522) 11 513 341<br />
| Introduction | Business Overview | Corporate Governance | Financial Statements | Other |<br />
MyBucks Annual Report 2016 138<br />
139 MyBucks Annual Report 2016