

Table of contents
MyBucks%20Annual%20Report%202016
MyBucks%20Annual%20Report%202016

You also want an ePaper? Increase the reach of your titles
YUMPU automatically turns print PDFs into web optimized ePapers that Google loves.
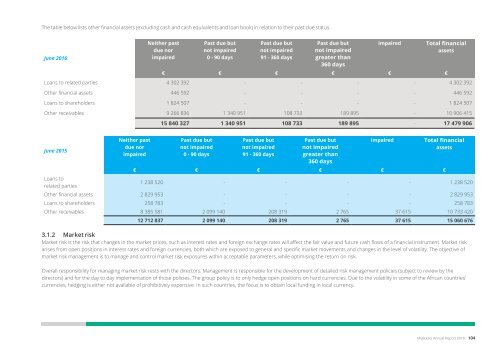
The table below lists other financial assets (excluding cash and cash equivalents and loan book) in relation to their past due status.<br />
June 2016<br />
Neither past<br />
due nor<br />
impaired<br />
Past due but<br />
not impaired<br />
0 - 90 days<br />
Past due but<br />
not impaired<br />
91 - 360 days<br />
Past due but<br />
not impaired<br />
greater than<br />
360 days<br />
Impaired<br />
Total financial<br />
assets<br />
€ € € € € €<br />
Loans to related parties 4 302 392 - - - - 4 302 392<br />
Other financial assets 446 592 - - - - 446 592<br />
Loans to shareholders 1 824 507 - - - - 1 824 507<br />
Other receivables 9 266 836 1 340 951 108 733 189 895 - 10 906 415<br />
June 2015<br />
Neither past<br />
due nor<br />
impaired<br />
15 840 327 1 340 951 108 733 189 895 - 17 479 906<br />
Past due but<br />
not impaired<br />
0 - 90 days<br />
Past due but<br />
not impaired<br />
91 - 360 days<br />
Past due but<br />
not impaired<br />
greater than<br />
360 days<br />
Impaired<br />
Total financial<br />
assets<br />
€ € € € € €<br />
Loans to<br />
related parties<br />
1 238 520 - - - - 1 238 520<br />
Other financial assets 2 829 953 - - - - 2 829 953<br />
Loans to shareholders 258 783 - - - - 258 783<br />
Other receivables 8 385 581 2 099 140 208 319 2 765 37 615 10 733 420<br />
12 712 837 2 099 140 208 319 2 765 37 615 15 060 676<br />
3.1.2 Market risk<br />
Market risk is the risk that changes in the market prices, such as interest rates and foreign exchange rates will affect the fair value and future cash flows <strong>of</strong> a financial instrument. Market risk<br />
arises from open positions in interest rates and foreign currencies, both which are exposed to general and specific market movements and changes in the level <strong>of</strong> volatility. The objective <strong>of</strong><br />
market risk management is to manage and control market risk exposures within acceptable parameters, while optimising the return on risk.<br />
Overall responsibility for managing market risk rests with the directors. Management is responsible for the development <strong>of</strong> detailed risk management policies (subject to review by the<br />
directors) and for the day to day implementation <strong>of</strong> those policies. The group policy is to only hedge open positions on hard currencies. Due to the volatility in some <strong>of</strong> the African countries’<br />
currencies, hedging is either not available <strong>of</strong> prohibitively expensive. In such countries, the focus is to obtain local funding in local currency.<br />
3.1.2.1 Interest rate risk<br />
Cash flow interest rate risk is the risk that the future cash<br />
flows <strong>of</strong> a financial instrument will fluctuate because <strong>of</strong><br />
changes in market interest rates. Fair value interest rate<br />
risk is the risk that the value <strong>of</strong> a financial instrument will<br />
fluctuate because <strong>of</strong> changes in market interest rates.<br />
The Group’s main interest rate risk arises from long-term<br />
borrowings which are issued at fixed and variable rates.<br />
These expose the Group to cash flow interest rate risk which<br />
is partially <strong>of</strong>fset by having a short-term loan portfolio as the<br />
main asset in the group. Increasing refinancing cost can be<br />
potentially covered by price changes in new lending (to the<br />
extent the relevant lending rates are governed by a formula<br />
linked to prime) whereby the spread between lending<br />
interest and borrowing interest is comparably high.<br />
The table below indicates all interest-bearing financial<br />
borrowings and all interest-bearing financial assets<br />
(excluding cash and cash equivalents, other receivables and<br />
trade and other payables) at fixed rates and variable rates.<br />
Fair value interest<br />
rate risk:<br />
2016 2015<br />
Fixed interestbearing<br />
assets<br />
€ €<br />
US Dollar 13 379 316 8 054 968<br />
Botswana Pula 6 227 668 5 564 925<br />
South African Rand 8 703 921 11 746 594<br />
Malawi Kwacha 4 006 876 5 032 866<br />
Kenya Shillings 4 380 370 4 360 794<br />
Euro 1 205 621 1 141 016<br />
Zambia Kwacha 6 802 796 -<br />
Other 1 232 832 2 329 012<br />
Total 45 939 400 38 230 175<br />
Fixed interestbearing<br />
2016 2015<br />
borrowings<br />
€ €<br />
US Dollar (34 949 560) (30 814 975)<br />
Botswana Pula (196 731) (184 720)<br />
South African Rand (7 141 108) (6 699 535)<br />
Euro (5 560 950) (5 374 986)<br />
Other - (940 751)<br />
Total (47 848 349) (44 014 967)<br />
Cash flow interest 2016 2015<br />
rate risk:<br />
Variable interestbearing<br />
assets<br />
€ €<br />
Botswana Pula 496 493 514 591<br />
South African Rand 1 274 722 1 378 258<br />
Total 1 771 215 1 892 849<br />
Variable interestbearing<br />
2016 2015<br />
borrowings € €<br />
Botswana Pula (287 245) (646 674)<br />
South African Rand (90 759) (50 969)<br />
Malawi Kwacha (2 186 638) (2 988 700)<br />
Kenya Shillings (836 039) (810 037)<br />
Zambia Kwacha (2 188 852) -<br />
Total (5 589 533) (4 496 380)<br />
Non-interest-bearing 2016 2015<br />
assets<br />
€ €<br />
US Dollar 63 824 15 254<br />
South African Rand - 376 943<br />
Other - 11 162<br />
Total 63 824 403 359<br />
Non-interest-bearing 2016 2015<br />
liabilities<br />
€ €<br />
South African Rand - (146 932)<br />
Total - (146 932)<br />
Cash flow interest rate sensitivity impact on pr<strong>of</strong>it<br />
or loss on financial assets and financial liabilities<br />
(excluding cash and cash equivalents, other receivables<br />
and trade and other payables)<br />
Assets<br />
Interest 2016 2015<br />
rate<br />
movement<br />
% € €<br />
Botswana Pula 1 4 965 5 146<br />
South African<br />
Rand<br />
1 12 747 13 783<br />
17 712 18 929<br />
Liabilities Interest 2016 2015<br />
rate<br />
movement<br />
% € €<br />
Botswana Pula 1 (2 872) (6 467)<br />
South African<br />
1 (908) (305)<br />
Rand<br />
Malawi Kwacha 5 (109 332) (149 435)<br />
Kenya Shillings 1 (8 360) (8 100)<br />
Zambia<br />
1 (21 889) -<br />
Kwacha<br />
(143 361) (164 307)<br />
| Introduction | Business Overview | Corporate Governance | Financial Statements | Other |<br />
MyBucks Annual Report 2016 104<br />
105 MyBucks Annual Report 2016