Mediterranean
5Lwz6ndOG
5Lwz6ndOG

You also want an ePaper? Increase the reach of your titles
YUMPU automatically turns print PDFs into web optimized ePapers that Google loves.
(NB: Unless otherwise stated the figures given in the following chapters refer to the year<br />
2010, which is the last year where a global set of data for the whole Corridor were<br />
available.)<br />
3.2 Current flows in the Corridor's market area<br />
In the 2014 Corridor Study, transport flows of goods and passengers were looked at from<br />
two different angles:<br />
1. First, the flows of goods and the movement of passengers between the Corridor<br />
countries were described. This gives a good picture of the utilisation of the<br />
infrastructure along the Corridor for the transport modes road, rail and sea.<br />
2. Then the flows of goods and passengers to and from the Corridor countries to the<br />
rest of Europe have been analysed based on origin-destination pairs that cross at<br />
least one common border of two Corridor countries. Thus the “market area” of the<br />
Corridor was captured allowing also a forecast for the year 2030, target date for<br />
the completion of the core network Corridors. (NB: due to the difficulty in<br />
obtaining origin-destination data for maritime transport, this mode is dealt with<br />
separately from the modes road and rail).<br />
Goods<br />
The six Corridor countries exchanged nearly 160 million tons of goods in 2010. The main<br />
flows are between Spain and France (45 million tons), and between France and Italy (36<br />
million tons). These two flows represent 60% of the goods exchanged between the six<br />
Corridor countries (in terms of weight).<br />
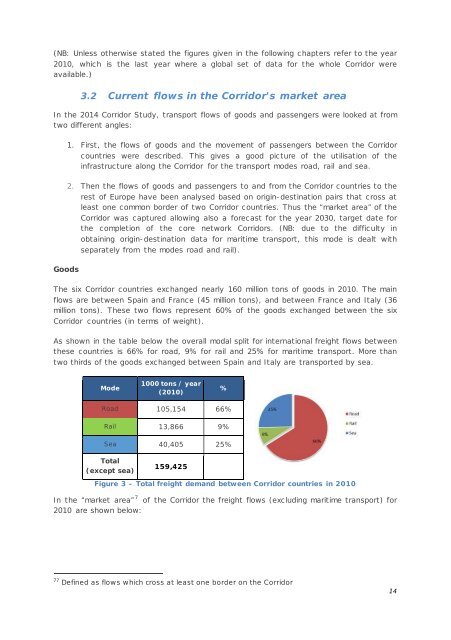
As shown in the table below the overall modal split for international freight flows between<br />
these countries is 66% for road, 9% for rail and 25% for maritime transport. More than<br />
two thirds of the goods exchanged between Spain and Italy are transported by sea.<br />
Mode<br />
1000 tons / year<br />
(2010)<br />
%<br />
Road 105,154 66%<br />
Rail 13,866 9%<br />
Sea 40,405 25%<br />
Total<br />
(except sea)<br />
159,425<br />
Figure 3 – Total freight demand between Corridor countries in 2010<br />
In the “market area” 7 of the Corridor the freight flows (excluding maritime transport) for<br />
2010 are shown below:<br />
77 Defined as flows which cross at least one border on the Corridor<br />
14