Mediterranean
5Lwz6ndOG
5Lwz6ndOG

You also want an ePaper? Increase the reach of your titles
YUMPU automatically turns print PDFs into web optimized ePapers that Google loves.
N° of projects<br />
120<br />
100<br />
80<br />
60<br />
40<br />
41<br />
31<br />
81<br />
42<br />
96<br />
71<br />
90<br />
80<br />
70<br />
60<br />
50<br />
40<br />
30<br />
Costs (B €)<br />
20<br />
19<br />
5<br />
14<br />
7<br />
20<br />
10<br />
0<br />
0<br />
N° of Projects Cost<br />
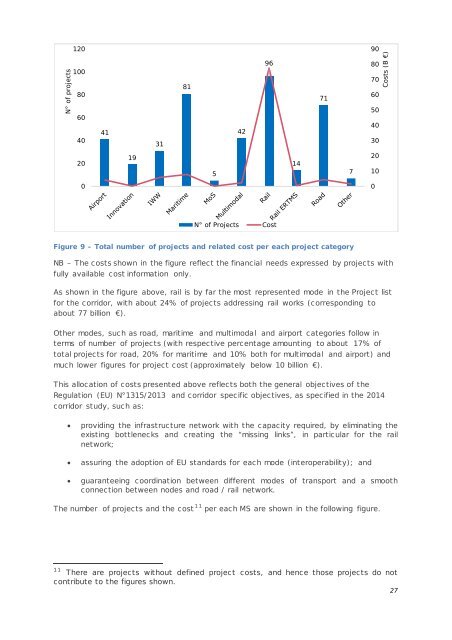
Figure 9 – Total number of projects and related cost per each project category<br />
NB – The costs shown in the figure reflect the financial needs expressed by projects with<br />
fully available cost information only.<br />
As shown in the figure above, rail is by far the most represented mode in the Project list<br />
for the corridor, with about 24% of projects addressing rail works (corresponding to<br />
about 77 billion €).<br />
Other modes, such as road, maritime and multimodal and airport categories follow in<br />
terms of number of projects (with respective percentage amounting to about 17% of<br />
total projects for road, 20% for maritime and 10% both for multimodal and airport) and<br />
much lower figures for project cost (approximately below 10 billion €).<br />
This allocation of costs presented above reflects both the general objectives of the<br />
Regulation (EU) N°1315/2013 and corridor specific objectives, as specified in the 2014<br />
corridor study, such as:<br />
• providing the infrastructure network with the capacity required, by eliminating the<br />
existing bottlenecks and creating the “missing links”, in particular for the rail<br />
network;<br />
• assuring the adoption of EU standards for each mode (interoperability); and<br />
• guaranteeing coordination between different modes of transport and a smooth<br />
connection between nodes and road / rail network.<br />
The number of projects and the cost 11 per each MS are shown in the following figure.<br />
11 There are projects without defined project costs, and hence those projects do not<br />
contribute to the figures shown.<br />
27