Mediterranean
5Lwz6ndOG
5Lwz6ndOG

Create successful ePaper yourself
Turn your PDF publications into a flip-book with our unique Google optimized e-Paper software.
Mode<br />
1000 tons / year<br />
(2010)<br />
%<br />
Rail<br />
15%<br />
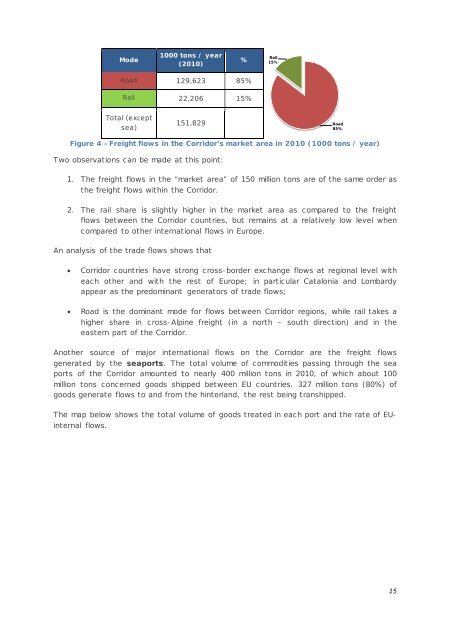
Road 129,623 85%<br />
Rail 22,206 15%<br />
Total (except<br />
sea)<br />
151,829<br />
Road<br />
85%<br />
Figure 4 –Freight flows in the Corridor’s market area in 2010 (1000 tons / year)<br />
Two observations can be made at this point:<br />
1. The freight flows in the “market area” of 150 million tons are of the same order as<br />
the freight flows within the Corridor.<br />
2. The rail share is slightly higher in the market area as compared to the freight<br />
flows between the Corridor countries, but remains at a relatively low level when<br />
compared to other international flows in Europe.<br />
An analysis of the trade flows shows that<br />
• Corridor countries have strong cross-border exchange flows at regional level with<br />
each other and with the rest of Europe; in particular Catalonia and Lombardy<br />
appear as the predominant generators of trade flows;<br />
• Road is the dominant mode for flows between Corridor regions, while rail takes a<br />
higher share in cross-Alpine freight (in a north – south direction) and in the<br />
eastern part of the Corridor.<br />
Another source of major international flows on the Corridor are the freight flows<br />
generated by the seaports. The total volume of commodities passing through the sea<br />
ports of the Corridor amounted to nearly 400 million tons in 2010, of which about 100<br />
million tons concerned goods shipped between EU countries. 327 million tons (80%) of<br />
goods generate flows to and from the hinterland, the rest being transhipped.<br />
The map below shows the total volume of goods treated in each port and the rate of EUinternal<br />
flows.<br />
15