Rebirth of Water Report 2016-2017
Marsh Creek, which is the largest watershed in greater Saint John, has been the recipient of centuries of untreated municipal wastewater deposition. Offensive odours, unsightly sanitary products and the threat posed by various human pathogens, resulting largely from the ~50 sewage outfalls in the lower reaches of Marsh Creek and the Saint John Harbour, have caused most residents to abandon the wellness of the watercourse. ACAP Saint John, a community-based ENGO and champion of the Harbour Cleanup project, has been conducting water quality monitoring and fish community surveys in the watershed since 1993 with the view towards someday restoring the ecological integrity of this forgotten natural asset.
Marsh Creek, which is the largest watershed in greater Saint John, has been the recipient of centuries of untreated municipal wastewater deposition. Offensive odours, unsightly sanitary products and the threat posed by various human pathogens, resulting largely from the ~50 sewage outfalls in the lower reaches of Marsh Creek and the Saint John Harbour, have caused most residents to abandon the wellness of the watercourse. ACAP Saint John, a community-based ENGO and champion of the Harbour Cleanup project, has been conducting water quality monitoring and fish community surveys in the watershed since 1993 with the view towards someday restoring the ecological integrity of this forgotten natural asset.

Create successful ePaper yourself
Turn your PDF publications into a flip-book with our unique Google optimized e-Paper software.
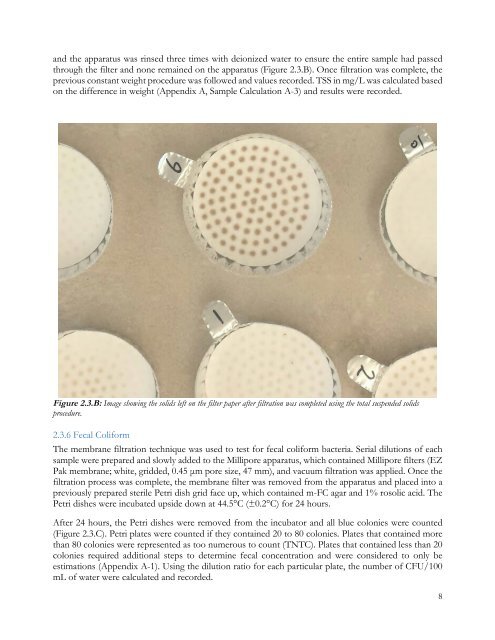
and the apparatus was rinsed three times with deionized water to ensure the entire sample had passed<br />
through the filter and none remained on the apparatus (Figure 2.3.B). Once filtration was complete, the<br />
previous constant weight procedure was followed and values recorded. TSS in mg/L was calculated based<br />
on the difference in weight (Appendix A, Sample Calculation A-3) and results were recorded.<br />
Figure 2.3.B: Image showing the solids left on the filter paper after filtration was completed using the total suspended solids<br />
procedure.<br />
2.3.6 Fecal Coliform<br />
The membrane filtration technique was used to test for fecal coliform bacteria. Serial dilutions <strong>of</strong> each<br />
sample were prepared and slowly added to the Millipore apparatus, which contained Millipore filters (EZ<br />
Pak membrane; white, gridded, 0.45 µm pore size, 47 mm), and vacuum filtration was applied. Once the<br />
filtration process was complete, the membrane filter was removed from the apparatus and placed into a<br />
previously prepared sterile Petri dish grid face up, which contained m-FC agar and 1% rosolic acid. The<br />
Petri dishes were incubated upside down at 44.5°C (±0.2°C) for 24 hours.<br />
After 24 hours, the Petri dishes were removed from the incubator and all blue colonies were counted<br />
(Figure 2.3.C). Petri plates were counted if they contained 20 to 80 colonies. Plates that contained more<br />
than 80 colonies were represented as too numerous to count (TNTC). Plates that contained less than 20<br />
colonies required additional steps to determine fecal concentration and were considered to only be<br />
estimations (Appendix A-1). Using the dilution ratio for each particular plate, the number <strong>of</strong> CFU/100<br />
mL <strong>of</strong> water were calculated and recorded.<br />
8