Rebirth of Water Report 2016-2017
Marsh Creek, which is the largest watershed in greater Saint John, has been the recipient of centuries of untreated municipal wastewater deposition. Offensive odours, unsightly sanitary products and the threat posed by various human pathogens, resulting largely from the ~50 sewage outfalls in the lower reaches of Marsh Creek and the Saint John Harbour, have caused most residents to abandon the wellness of the watercourse. ACAP Saint John, a community-based ENGO and champion of the Harbour Cleanup project, has been conducting water quality monitoring and fish community surveys in the watershed since 1993 with the view towards someday restoring the ecological integrity of this forgotten natural asset.
Marsh Creek, which is the largest watershed in greater Saint John, has been the recipient of centuries of untreated municipal wastewater deposition. Offensive odours, unsightly sanitary products and the threat posed by various human pathogens, resulting largely from the ~50 sewage outfalls in the lower reaches of Marsh Creek and the Saint John Harbour, have caused most residents to abandon the wellness of the watercourse. ACAP Saint John, a community-based ENGO and champion of the Harbour Cleanup project, has been conducting water quality monitoring and fish community surveys in the watershed since 1993 with the view towards someday restoring the ecological integrity of this forgotten natural asset.

Create successful ePaper yourself
Turn your PDF publications into a flip-book with our unique Google optimized e-Paper software.
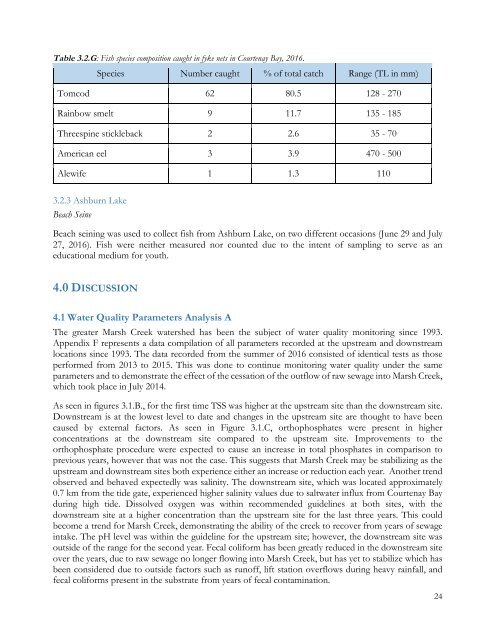
Table 3.2.G: Fish species composition caught in fyke nets in Courtenay Bay, <strong>2016</strong>.<br />
Species Number caught % <strong>of</strong> total catch Range (TL in mm)<br />
Tomcod 62 80.5 128 - 270<br />
Rainbow smelt 9 11.7 135 - 185<br />
Threespine stickleback 2 2.6 35 - 70<br />
American eel 3 3.9 470 - 500<br />
Alewife 1 1.3 110<br />
3.2.3 Ashburn Lake<br />
Beach Seine<br />
Beach seining was used to collect fish from Ashburn Lake, on two different occasions (June 29 and July<br />
27, <strong>2016</strong>). Fish were neither measured nor counted due to the intent <strong>of</strong> sampling to serve as an<br />
educational medium for youth.<br />
4.0 DISCUSSION<br />
4.1 <strong>Water</strong> Quality Parameters Analysis A<br />
The greater Marsh Creek watershed has been the subject <strong>of</strong> water quality monitoring since 1993.<br />
Appendix F represents a data compilation <strong>of</strong> all parameters recorded at the upstream and downstream<br />
locations since 1993. The data recorded from the summer <strong>of</strong> <strong>2016</strong> consisted <strong>of</strong> identical tests as those<br />
performed from 2013 to 2015. This was done to continue monitoring water quality under the same<br />
parameters and to demonstrate the effect <strong>of</strong> the cessation <strong>of</strong> the outflow <strong>of</strong> raw sewage into Marsh Creek,<br />
which took place in July 2014.<br />
As seen in figures 3.1.B., for the first time TSS was higher at the upstream site than the downstream site.<br />
Downstream is at the lowest level to date and changes in the upstream site are thought to have been<br />
caused by external factors. As seen in Figure 3.1.C, orthophosphates were present in higher<br />
concentrations at the downstream site compared to the upstream site. Improvements to the<br />
orthophosphate procedure were expected to cause an increase in total phosphates in comparison to<br />
previous years, however that was not the case. This suggests that Marsh Creek may be stabilizing as the<br />
upstream and downstream sites both experience either an increase or reduction each year. Another trend<br />
observed and behaved expectedly was salinity. The downstream site, which was located approximately<br />
0.7 km from the tide gate, experienced higher salinity values due to saltwater influx from Courtenay Bay<br />
during high tide. Dissolved oxygen was within recommended guidelines at both sites, with the<br />
downstream site at a higher concentration than the upstream site for the last three years. This could<br />
become a trend for Marsh Creek, demonstrating the ability <strong>of</strong> the creek to recover from years <strong>of</strong> sewage<br />
intake. The pH level was within the guideline for the upstream site; however, the downstream site was<br />
outside <strong>of</strong> the range for the second year. Fecal coliform has been greatly reduced in the downstream site<br />
over the years, due to raw sewage no longer flowing into Marsh Creek, but has yet to stabilize which has<br />
been considered due to outside factors such as run<strong>of</strong>f, lift station overflows during heavy rainfall, and<br />
fecal coliforms present in the substrate from years <strong>of</strong> fecal contamination.<br />
24