Rebirth of Water Report 2016-2017
Marsh Creek, which is the largest watershed in greater Saint John, has been the recipient of centuries of untreated municipal wastewater deposition. Offensive odours, unsightly sanitary products and the threat posed by various human pathogens, resulting largely from the ~50 sewage outfalls in the lower reaches of Marsh Creek and the Saint John Harbour, have caused most residents to abandon the wellness of the watercourse. ACAP Saint John, a community-based ENGO and champion of the Harbour Cleanup project, has been conducting water quality monitoring and fish community surveys in the watershed since 1993 with the view towards someday restoring the ecological integrity of this forgotten natural asset.
Marsh Creek, which is the largest watershed in greater Saint John, has been the recipient of centuries of untreated municipal wastewater deposition. Offensive odours, unsightly sanitary products and the threat posed by various human pathogens, resulting largely from the ~50 sewage outfalls in the lower reaches of Marsh Creek and the Saint John Harbour, have caused most residents to abandon the wellness of the watercourse. ACAP Saint John, a community-based ENGO and champion of the Harbour Cleanup project, has been conducting water quality monitoring and fish community surveys in the watershed since 1993 with the view towards someday restoring the ecological integrity of this forgotten natural asset.

You also want an ePaper? Increase the reach of your titles
YUMPU automatically turns print PDFs into web optimized ePapers that Google loves.
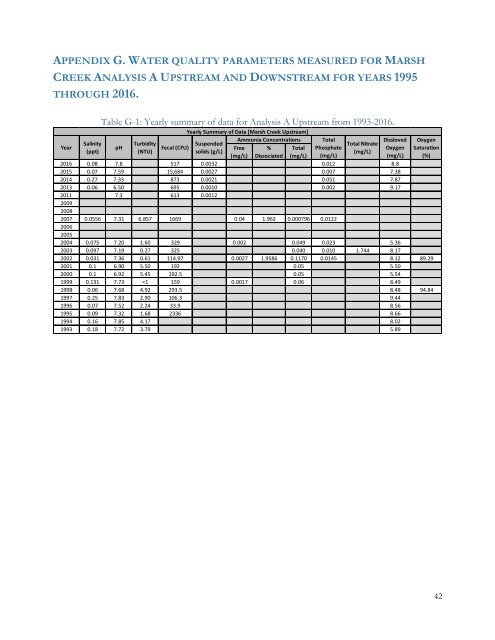
APPENDIX G. WATER QUALITY PARAMETERS MEASURED FOR MARSH<br />
CREEK ANALYSIS A UPSTREAM AND DOWNSTREAM FOR YEARS 1995<br />
THROUGH <strong>2016</strong>.<br />
Table G-1: Yearly summary <strong>of</strong> data for Analysis A Upstream from 1993-<strong>2016</strong>.<br />
Yearly Summary <strong>of</strong> Data [Marsh Creek Upstream]<br />
Year<br />
Ammonia Concentrations Total<br />
Dissloved Oxygen<br />
Salinity<br />
Turbidity<br />
Suspended<br />
Total Nitrate<br />
pH<br />
Fecal (CFU)<br />
Free % Total Phosphate<br />
Oxygen Saturation<br />
(ppt)<br />
(NTU)<br />
solids (g/L)<br />
(mg/L)<br />
(mg/L) Dissociated (mg/L) (mg/L)<br />
(mg/L) (%)<br />
<strong>2016</strong> 0.08 7.8 517 0.0032 0.012 8.8<br />
2015 0.07 7.59 15,684 0.0027 0.007 7.38<br />
2014 0.27 7.33 873 0.0021 0.051 7.87<br />
2013 0.06 6.50 695 0.0010 0.002 9.17<br />
2011 7.3 613 0.0012<br />
2009<br />
2008<br />
2007 0.0556 7.31 6.857 1669 0.04 1.962 0.000796 0.0122<br />
2006<br />
2005<br />
2004 0.075 7.20 1.60 329 0.002 0.049 0.023 5.36<br />
2003 0.097 7.19 0.27 325 0.040 0.010 1.744 8.17<br />
2002 0.031 7.36 0.61 114.97 0.0027 1.9586 0.1170 0.0145 8.12 89.29<br />
2001 0.1 6.90 5.50 192 0.05 5.50<br />
2000 0.1 6.92 5.45 192.5 0.05 5.54<br />
1999 0.131 7.73