Rebirth of Water Report 2016-2017
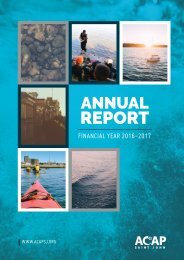
Marsh Creek, which is the largest watershed in greater Saint John, has been the recipient of centuries of untreated municipal wastewater deposition. Offensive odours, unsightly sanitary products and the threat posed by various human pathogens, resulting largely from the ~50 sewage outfalls in the lower reaches of Marsh Creek and the Saint John Harbour, have caused most residents to abandon the wellness of the watercourse. ACAP Saint John, a community-based ENGO and champion of the Harbour Cleanup project, has been conducting water quality monitoring and fish community surveys in the watershed since 1993 with the view towards someday restoring the ecological integrity of this forgotten natural asset.
Marsh Creek, which is the largest watershed in greater Saint John, has been the recipient of centuries of untreated municipal wastewater deposition. Offensive odours, unsightly sanitary products and the threat posed by various human pathogens, resulting largely from the ~50 sewage outfalls in the lower reaches of Marsh Creek and the Saint John Harbour, have caused most residents to abandon the wellness of the watercourse. ACAP Saint John, a community-based ENGO and champion of the Harbour Cleanup project, has been conducting water quality monitoring and fish community surveys in the watershed since 1993 with the view towards someday restoring the ecological integrity of this forgotten natural asset.
You also want an ePaper? Increase the reach of your titles
YUMPU automatically turns print PDFs into web optimized ePapers that Google loves.
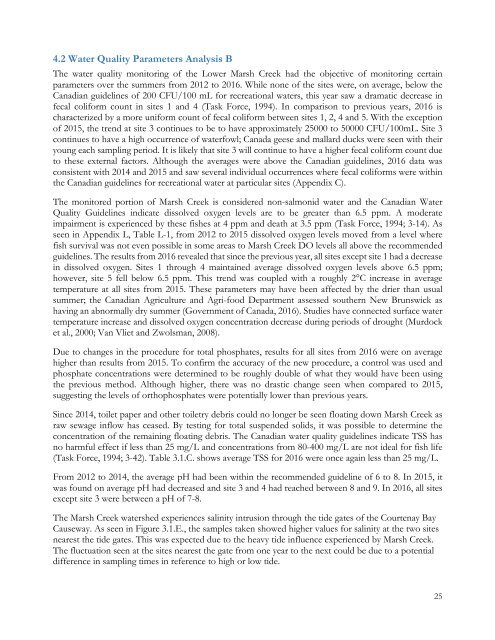
4.2 <strong>Water</strong> Quality Parameters Analysis B<br />
The water quality monitoring <strong>of</strong> the Lower Marsh Creek had the objective <strong>of</strong> monitoring certain<br />
parameters over the summers from 2012 to <strong>2016</strong>. While none <strong>of</strong> the sites were, on average, below the<br />
Canadian guidelines <strong>of</strong> 200 CFU/100 mL for recreational waters, this year saw a dramatic decrease in<br />
fecal coliform count in sites 1 and 4 (Task Force, 1994). In comparison to previous years, <strong>2016</strong> is<br />
characterized by a more uniform count <strong>of</strong> fecal coliform between sites 1, 2, 4 and 5. With the exception<br />
<strong>of</strong> 2015, the trend at site 3 continues to be to have approximately 25000 to 50000 CFU/100mL. Site 3<br />
continues to have a high occurrence <strong>of</strong> waterfowl; Canada geese and mallard ducks were seen with their<br />
young each sampling period. It is likely that site 3 will continue to have a higher fecal coliform count due<br />
to these external factors. Although the averages were above the Canadian guidelines, <strong>2016</strong> data was<br />
consistent with 2014 and 2015 and saw several individual occurrences where fecal coliforms were within<br />
the Canadian guidelines for recreational water at particular sites (Appendix C).<br />
The monitored portion <strong>of</strong> Marsh Creek is considered non-salmonid water and the Canadian <strong>Water</strong><br />
Quality Guidelines indicate dissolved oxygen levels are to be greater than 6.5 ppm. A moderate<br />
impairment is experienced by these fishes at 4 ppm and death at 3.5 ppm (Task Force, 1994; 3-14). As<br />
seen in Appendix L, Table L-1, from 2012 to 2015 dissolved oxygen levels moved from a level where<br />
fish survival was not even possible in some areas to Marsh Creek DO levels all above the recommended<br />
guidelines. The results from <strong>2016</strong> revealed that since the previous year, all sites except site 1 had a decrease<br />
in dissolved oxygen. Sites 1 through 4 maintained average dissolved oxygen levels above 6.5 ppm;<br />
however, site 5 fell below 6.5 ppm. This trend was coupled with a roughly 2°C increase in average<br />
temperature at all sites from 2015. These parameters may have been affected by the drier than usual<br />
summer; the Canadian Agriculture and Agri-food Department assessed southern New Brunswick as<br />
having an abnormally dry summer (Government <strong>of</strong> Canada, <strong>2016</strong>). Studies have connected surface water<br />
temperature increase and dissolved oxygen concentration decrease during periods <strong>of</strong> drought (Murdock<br />
et al., 2000; Van Vliet and Zwolsman, 2008).<br />
Due to changes in the procedure for total phosphates, results for all sites from <strong>2016</strong> were on average<br />
higher than results from 2015. To confirm the accuracy <strong>of</strong> the new procedure, a control was used and<br />
phosphate concentrations were determined to be roughly double <strong>of</strong> what they would have been using<br />
the previous method. Although higher, there was no drastic change seen when compared to 2015,<br />
suggesting the levels <strong>of</strong> orthophosphates were potentially lower than previous years.<br />
Since 2014, toilet paper and other toiletry debris could no longer be seen floating down Marsh Creek as<br />
raw sewage inflow has ceased. By testing for total suspended solids, it was possible to determine the<br />
concentration <strong>of</strong> the remaining floating debris. The Canadian water quality guidelines indicate TSS has<br />
no harmful effect if less than 25 mg/L and concentrations from 80-400 mg/L are not ideal for fish life<br />
(Task Force, 1994; 3-42). Table 3.1.C. shows average TSS for <strong>2016</strong> were once again less than 25 mg/L.<br />
From 2012 to 2014, the average pH had been within the recommended guideline <strong>of</strong> 6 to 8. In 2015, it<br />
was found on average pH had decreased and site 3 and 4 had reached between 8 and 9. In <strong>2016</strong>, all sites<br />
except site 3 were between a pH <strong>of</strong> 7-8.<br />
The Marsh Creek watershed experiences salinity intrusion through the tide gates <strong>of</strong> the Courtenay Bay<br />
Causeway. As seen in Figure 3.1.E., the samples taken showed higher values for salinity at the two sites<br />
nearest the tide gates. This was expected due to the heavy tide influence experienced by Marsh Creek.<br />
The fluctuation seen at the sites nearest the gate from one year to the next could be due to a potential<br />
difference in sampling times in reference to high or low tide.<br />
25


