Rebirth of Water Report 2016-2017
Marsh Creek, which is the largest watershed in greater Saint John, has been the recipient of centuries of untreated municipal wastewater deposition. Offensive odours, unsightly sanitary products and the threat posed by various human pathogens, resulting largely from the ~50 sewage outfalls in the lower reaches of Marsh Creek and the Saint John Harbour, have caused most residents to abandon the wellness of the watercourse. ACAP Saint John, a community-based ENGO and champion of the Harbour Cleanup project, has been conducting water quality monitoring and fish community surveys in the watershed since 1993 with the view towards someday restoring the ecological integrity of this forgotten natural asset.
Marsh Creek, which is the largest watershed in greater Saint John, has been the recipient of centuries of untreated municipal wastewater deposition. Offensive odours, unsightly sanitary products and the threat posed by various human pathogens, resulting largely from the ~50 sewage outfalls in the lower reaches of Marsh Creek and the Saint John Harbour, have caused most residents to abandon the wellness of the watercourse. ACAP Saint John, a community-based ENGO and champion of the Harbour Cleanup project, has been conducting water quality monitoring and fish community surveys in the watershed since 1993 with the view towards someday restoring the ecological integrity of this forgotten natural asset.

You also want an ePaper? Increase the reach of your titles
YUMPU automatically turns print PDFs into web optimized ePapers that Google loves.
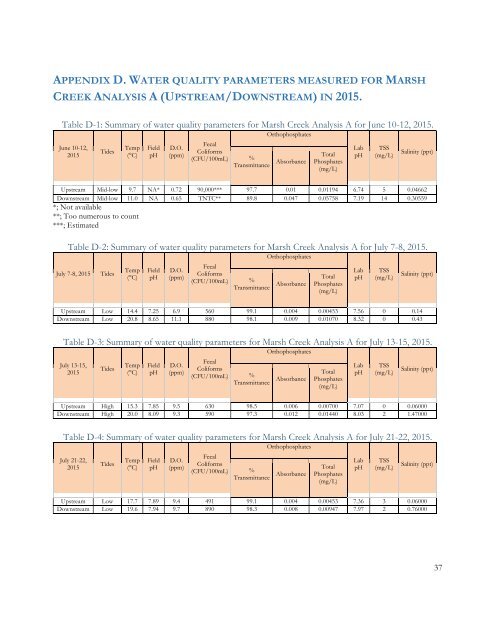
APPENDIX D. WATER QUALITY PARAMETERS MEASURED FOR MARSH<br />
CREEK ANALYSIS A (UPSTREAM/DOWNSTREAM) IN 2015.<br />
Table D-1: Summary <strong>of</strong> water quality parameters for Marsh Creek Analysis A for June 10-12, 2015.<br />
June 10-12,<br />
2015<br />
Tides<br />
Temp<br />
(°C)<br />
Field<br />
pH<br />
D.O.<br />
(ppm)<br />
Fecal<br />
Coliforms<br />
(CFU/100mL)<br />
Orthophosphates<br />
%<br />
Transmittance Absorbance<br />
Total<br />
Phosphates<br />
(mg/L)<br />
Lab<br />
pH<br />
TSS<br />
(mg/L)<br />
Salinity (ppt)<br />
Upstream Mid-low 9.7 NA* 0.72 90,000*** 97.7 0.01 0.01194 6.74 5 0.04662<br />
Downstream Mid-low 11.0 NA 0.65 TNTC** 89.8 0.047 0.05758 7.19 14 0.30559<br />
*; Not available<br />
**; Too numerous to count<br />
***; Estimated<br />
Table D-2: Summary <strong>of</strong> water quality parameters for Marsh Creek Analysis A for July 7-8, 2015.<br />
July 7-8, 2015 Tides<br />
Temp<br />
(°C)<br />
Field<br />
pH<br />
D.O.<br />
(ppm)<br />
Fecal<br />
Coliforms<br />
(CFU/100mL)<br />
Orthophosphates<br />
%<br />
Transmittance Absorbance<br />
Total<br />
Phosphates<br />
(mg/L)<br />
Lab<br />
pH<br />
TSS<br />
(mg/L)<br />
Salinity (ppt)<br />
Upstream Low 14.4 7.25 6.9 560 99.1 0.004 0.00453 7.56 0 0.14<br />
Downstream Low 20.8 8.65 11.1 880 98.1 0.009 0.01070 8.32 0 0.43<br />
Table D-3: Summary <strong>of</strong> water quality parameters for Marsh Creek Analysis A for July 13-15, 2015.<br />
July 13-15,<br />
2015<br />
Tides<br />
Temp<br />
(°C)<br />
Field<br />
pH<br />
D.O.<br />
(ppm)<br />
Fecal<br />
Coliforms<br />
(CFU/100mL)<br />
Orthophosphates<br />
%<br />
Transmittance Absorbance<br />
Total<br />
Phosphates<br />
(mg/L)<br />
Lab<br />
pH<br />
TSS<br />
(mg/L)<br />
Salinity (ppt)<br />
Upstream High 15.3 7.85 9.5 630 98.5 0.006 0.00700 7.07 0 0.06000<br />
Downstream High 20.0 8.09 9.3 590 97.3 0.012 0.01440 8.03 2 1.47000<br />
Table D-4: Summary <strong>of</strong> water quality parameters for Marsh Creek Analysis A for July 21-22, 2015.<br />
July 21-22,<br />
2015<br />
Tides<br />
Temp<br />
(°C)<br />
Field<br />
pH<br />
D.O.<br />
(ppm)<br />
Fecal<br />
Coliforms<br />
(CFU/100mL)<br />
Orthophosphates<br />
%<br />
Transmittance Absorbance<br />
Total<br />
Phosphates<br />
(mg/L)<br />
Lab<br />
pH<br />
TSS<br />
(mg/L)<br />
Salinity (ppt)<br />
Upstream Low 17.7 7.89 9.4 491 99.1 0.004 0.00453 7.36 3 0.06000<br />
Downstream Low 19.6 7.94 9.7 890 98.3 0.008 0.00947 7.97 2 0.76000<br />
37