Rebirth of Water Report 2016-2017
Marsh Creek, which is the largest watershed in greater Saint John, has been the recipient of centuries of untreated municipal wastewater deposition. Offensive odours, unsightly sanitary products and the threat posed by various human pathogens, resulting largely from the ~50 sewage outfalls in the lower reaches of Marsh Creek and the Saint John Harbour, have caused most residents to abandon the wellness of the watercourse. ACAP Saint John, a community-based ENGO and champion of the Harbour Cleanup project, has been conducting water quality monitoring and fish community surveys in the watershed since 1993 with the view towards someday restoring the ecological integrity of this forgotten natural asset.
Marsh Creek, which is the largest watershed in greater Saint John, has been the recipient of centuries of untreated municipal wastewater deposition. Offensive odours, unsightly sanitary products and the threat posed by various human pathogens, resulting largely from the ~50 sewage outfalls in the lower reaches of Marsh Creek and the Saint John Harbour, have caused most residents to abandon the wellness of the watercourse. ACAP Saint John, a community-based ENGO and champion of the Harbour Cleanup project, has been conducting water quality monitoring and fish community surveys in the watershed since 1993 with the view towards someday restoring the ecological integrity of this forgotten natural asset.

Create successful ePaper yourself
Turn your PDF publications into a flip-book with our unique Google optimized e-Paper software.
7<br />
6<br />
5<br />
Upstream<br />
Downstream<br />
Salinity (ppt)<br />
4<br />
3<br />
2<br />
1<br />
0<br />
1992 1995 1998 2001 2004 2007 2010 2013 <strong>2016</strong><br />
Year<br />
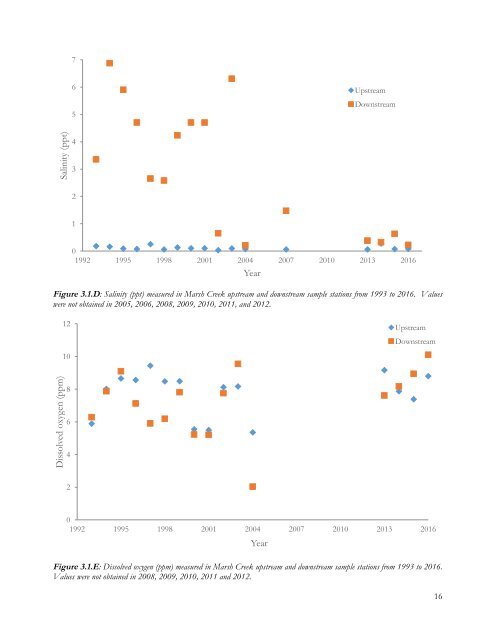
Figure 3.1.D: Salinity (ppt) measured in Marsh Creek upstream and downstream sample stations from 1993 to <strong>2016</strong>. Values<br />
were not obtained in 2005, 2006, 2008, 2009, 2010, 2011, and 2012.<br />
12<br />
10<br />
Upstream<br />
Downstream<br />
Dissolved oxygen (ppm)<br />
8<br />
6<br />
4<br />
2<br />
0<br />
1992 1995 1998 2001 2004 2007 2010 2013 <strong>2016</strong><br />
Figure 3.1.E: Dissolved oxygen (ppm) measured in Marsh Creek upstream and downstream sample stations from 1993 to <strong>2016</strong>.<br />
Values were not obtained in 2008, 2009, 2010, 2011 and 2012.<br />
Year<br />
16