Rebirth of Water Report 2016-2017
Marsh Creek, which is the largest watershed in greater Saint John, has been the recipient of centuries of untreated municipal wastewater deposition. Offensive odours, unsightly sanitary products and the threat posed by various human pathogens, resulting largely from the ~50 sewage outfalls in the lower reaches of Marsh Creek and the Saint John Harbour, have caused most residents to abandon the wellness of the watercourse. ACAP Saint John, a community-based ENGO and champion of the Harbour Cleanup project, has been conducting water quality monitoring and fish community surveys in the watershed since 1993 with the view towards someday restoring the ecological integrity of this forgotten natural asset.
Marsh Creek, which is the largest watershed in greater Saint John, has been the recipient of centuries of untreated municipal wastewater deposition. Offensive odours, unsightly sanitary products and the threat posed by various human pathogens, resulting largely from the ~50 sewage outfalls in the lower reaches of Marsh Creek and the Saint John Harbour, have caused most residents to abandon the wellness of the watercourse. ACAP Saint John, a community-based ENGO and champion of the Harbour Cleanup project, has been conducting water quality monitoring and fish community surveys in the watershed since 1993 with the view towards someday restoring the ecological integrity of this forgotten natural asset.

Create successful ePaper yourself
Turn your PDF publications into a flip-book with our unique Google optimized e-Paper software.
July 21-22,<br />
2015<br />
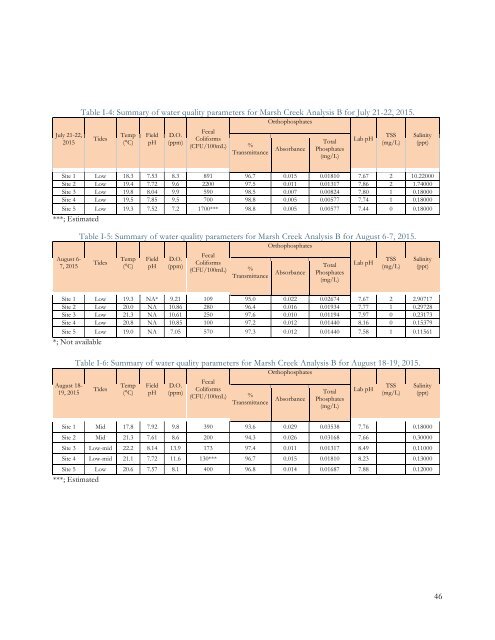
Table I-4: Summary <strong>of</strong> water quality parameters for Marsh Creek Analysis B for July 21-22, 2015.<br />
Tides<br />
Temp<br />
(°C)<br />
Field<br />
pH<br />
D.O.<br />
(ppm)<br />
Fecal<br />
Coliforms<br />
(CFU/100mL)<br />
Orthophosphates<br />
%<br />
Transmittance<br />
Absorbance<br />
Total<br />
Phosphates<br />
(mg/L)<br />
Lab pH<br />
TSS<br />
(mg/L)<br />
Site 1 Low 18.3 7.53 8.3 891 96.7 0.015 0.01810 7.67 2 10.22000<br />
Site 2 Low 19.4 7.72 9.6 2200 97.5 0.011 0.01317 7.86 2 1.74000<br />
Site 3 Low 19.8 8.04 9.9 590 98.5 0.007 0.00824 7.80 1 0.18000<br />
Site 4 Low 19.5 7.85 9.5 700 98.8 0.005 0.00577 7.74 1 0.18000<br />
Site 5 Low 19.3 7.52 7.2 1700*** 98.8 0.005 0.00577 7.44 0 0.18000<br />
***; Estimated<br />
August 6-<br />
7, 2015<br />
Table I-5: Summary <strong>of</strong> water quality parameters for Marsh Creek Analysis B for August 6-7, 2015.<br />
Tides<br />
Temp<br />
(°C)<br />
Field<br />
pH<br />
D.O.<br />
(ppm)<br />
Fecal<br />
Coliforms<br />
(CFU/100mL)<br />
%<br />
Transmittance<br />
Orthophosphates<br />
Absorbance<br />
Total<br />
Phosphates<br />
(mg/L)<br />
Lab pH<br />
TSS<br />
(mg/L)<br />
Site 1 Low 19.3 NA* 9.21 109 95.0 0.022 0.02674 7.67 2 2.90717<br />
Site 2 Low 20.0 NA 10.86 280 96.4 0.016 0.01934 7.77 1 0.29728<br />
Site 3 Low 21.3 NA 10.61 250 97.6 0.010 0.01194 7.97 0 0.23173<br />
Site 4 Low 20.8 NA 10.85 100 97.2 0.012 0.01440 8.16 0 0.15379<br />
Site 5 Low 19.0 NA 7.05 570 97.3 0.012 0.01440 7.58 1 0.11561<br />
*; Not available<br />
Table I-6: Summary <strong>of</strong> water quality parameters for Marsh Creek Analysis B for August 18-19, 2015.<br />
August 18-<br />
19, 2015<br />
Tides<br />
Temp<br />
(°C)<br />
Field<br />
pH<br />
D.O.<br />
(ppm)<br />
Fecal<br />
Coliforms<br />
(CFU/100mL)<br />
Orthophosphates<br />
%<br />
Transmittance<br />
Absorbance<br />
Total<br />
Phosphates<br />
(mg/L)<br />
Lab pH<br />
TSS<br />
(mg/L)<br />
Salinity<br />
(ppt)<br />
Salinity<br />
(ppt)<br />
Salinity<br />
(ppt)<br />
Site 1 Mid 17.8 7.92 9.8 390 93.6 0.029 0.03538 7.76 0.18000<br />
Site 2 Mid 21.3 7.61 8.6 200 94.3 0.026 0.03168 7.66 0.30000<br />
Site 3 Low-mid 22.2 8.14 13.9 173 97.4 0.011 0.01317 8.49 0.11000<br />
Site 4 Low-mid 21.1 7.72 11.6 130*** 96.7 0.015 0.01810 8.23 0.13000<br />
Site 5 Low 20.6 7.57 8.1 400 96.8 0.014 0.01687 7.88 0.12000<br />
***; Estimated<br />
46