Rebirth of Water Report 2016-2017
Marsh Creek, which is the largest watershed in greater Saint John, has been the recipient of centuries of untreated municipal wastewater deposition. Offensive odours, unsightly sanitary products and the threat posed by various human pathogens, resulting largely from the ~50 sewage outfalls in the lower reaches of Marsh Creek and the Saint John Harbour, have caused most residents to abandon the wellness of the watercourse. ACAP Saint John, a community-based ENGO and champion of the Harbour Cleanup project, has been conducting water quality monitoring and fish community surveys in the watershed since 1993 with the view towards someday restoring the ecological integrity of this forgotten natural asset.
Marsh Creek, which is the largest watershed in greater Saint John, has been the recipient of centuries of untreated municipal wastewater deposition. Offensive odours, unsightly sanitary products and the threat posed by various human pathogens, resulting largely from the ~50 sewage outfalls in the lower reaches of Marsh Creek and the Saint John Harbour, have caused most residents to abandon the wellness of the watercourse. ACAP Saint John, a community-based ENGO and champion of the Harbour Cleanup project, has been conducting water quality monitoring and fish community surveys in the watershed since 1993 with the view towards someday restoring the ecological integrity of this forgotten natural asset.

Create successful ePaper yourself
Turn your PDF publications into a flip-book with our unique Google optimized e-Paper software.
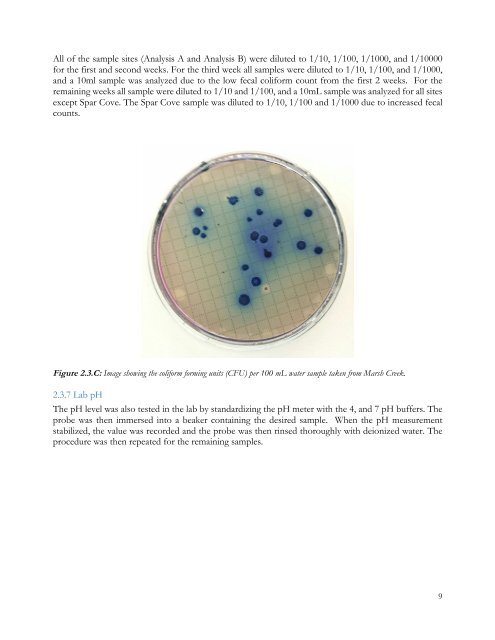
All <strong>of</strong> the sample sites (Analysis A and Analysis B) were diluted to 1/10, 1/100, 1/1000, and 1/10000<br />
for the first and second weeks. For the third week all samples were diluted to 1/10, 1/100, and 1/1000,<br />
and a 10ml sample was analyzed due to the low fecal coliform count from the first 2 weeks. For the<br />
remaining weeks all sample were diluted to 1/10 and 1/100, and a 10mL sample was analyzed for all sites<br />
except Spar Cove. The Spar Cove sample was diluted to 1/10, 1/100 and 1/1000 due to increased fecal<br />
counts.<br />
Figure 2.3.C: Image showing the coliform forming units (CFU) per 100 mL water sample taken from Marsh Creek.<br />
2.3.7 Lab pH<br />
The pH level was also tested in the lab by standardizing the pH meter with the 4, and 7 pH buffers. The<br />
probe was then immersed into a beaker containing the desired sample. When the pH measurement<br />
stabilized, the value was recorded and the probe was then rinsed thoroughly with deionized water. The<br />
procedure was then repeated for the remaining samples.<br />
9