Rebirth of Water Report 2016-2017
Marsh Creek, which is the largest watershed in greater Saint John, has been the recipient of centuries of untreated municipal wastewater deposition. Offensive odours, unsightly sanitary products and the threat posed by various human pathogens, resulting largely from the ~50 sewage outfalls in the lower reaches of Marsh Creek and the Saint John Harbour, have caused most residents to abandon the wellness of the watercourse. ACAP Saint John, a community-based ENGO and champion of the Harbour Cleanup project, has been conducting water quality monitoring and fish community surveys in the watershed since 1993 with the view towards someday restoring the ecological integrity of this forgotten natural asset.
Marsh Creek, which is the largest watershed in greater Saint John, has been the recipient of centuries of untreated municipal wastewater deposition. Offensive odours, unsightly sanitary products and the threat posed by various human pathogens, resulting largely from the ~50 sewage outfalls in the lower reaches of Marsh Creek and the Saint John Harbour, have caused most residents to abandon the wellness of the watercourse. ACAP Saint John, a community-based ENGO and champion of the Harbour Cleanup project, has been conducting water quality monitoring and fish community surveys in the watershed since 1993 with the view towards someday restoring the ecological integrity of this forgotten natural asset.

Create successful ePaper yourself
Turn your PDF publications into a flip-book with our unique Google optimized e-Paper software.
3.0 RESULTS<br />
3.1 <strong>Water</strong> Quality Parameters<br />
Confirmation was made that municipal wastewater outfalls had been diverted from Marsh Creek and the<br />
municipal wastewater system was ‘online’ after the final piece <strong>of</strong> infrastructure, the Mill Street Lift Station,<br />
was commissioned in October 2014.<br />
3.1.1 Analysis A <strong>Water</strong> Quality Parameters<br />
<strong>Water</strong> quality parameters averaged across five sample periods in <strong>2016</strong> (Appendix C) showed marked<br />
differences in temperature, dissolved oxygen, fecal coliforms, total phosphates, total suspended solids<br />
and salinity between the upstream and downstream sites (Table 3.1.A).<br />
Due to lack <strong>of</strong> available equipment, pH, temperature, dissolved oxygen, and salinity were not tested<br />
during the weeks <strong>of</strong> June 14-16 and June 28-30, <strong>2016</strong>. The average pH, temperature, dissolved oxygen<br />
and salinity (Table 3.1A) are representative <strong>of</strong> the values obtained during the remaining sample periods.<br />
Due to the heavy rainfall that occurred from June 12-13, <strong>2016</strong>, and high winds experienced during<br />
sampling the results for fecal coliforms from the sample period <strong>of</strong> June 14-16, <strong>2016</strong> are not consistent<br />
with the other sample periods. This resulted in a high degree <strong>of</strong> within site variability with a standard<br />
deviation <strong>of</strong> 812 and 89364 CFU/100mL in upstream and downstream sites, respectively (Table 3.1B).<br />
The difference in results are thought to have been due to the increase in run<strong>of</strong>f and potential overflow<br />
<strong>of</strong> sewage facilities near Marsh Creek.<br />
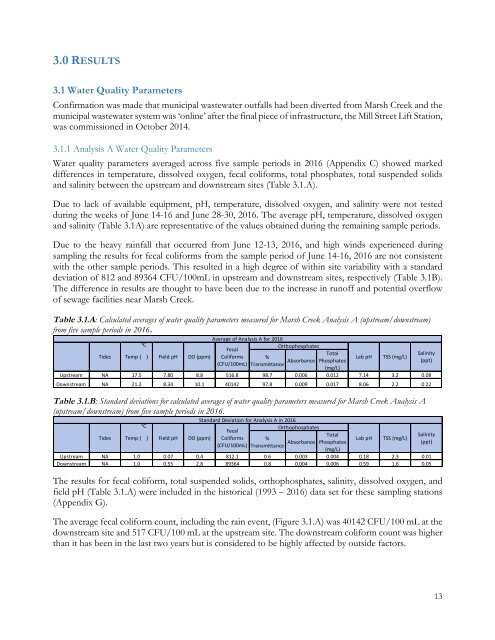
Table 3.1.A: Calculated averages <strong>of</strong> water quality parameters measured for Marsh Creek Analysis A (upstream/downstream)<br />
from five sample periods in <strong>2016</strong>.<br />
Average <strong>of</strong> Analysis A for <strong>2016</strong><br />
℃<br />
Orthophosphates<br />
Fecal<br />
Total<br />
Salinity<br />
Tides Temp ( ) Field pH DO (ppm) Coliforms %<br />
Transmittance Absorbance<br />
Lab pH TSS (mg/L)<br />
Phosphates<br />
(ppt)<br />
(CFU/100mL)<br />
(mg/L)<br />
Upstream NA 17.5 7.80 8.8 516.8 98.7 0.006 0.012 7.14 3.2 0.08<br />
Downstream NA 21.2 8.34 10.1 40142 97.8 0.009 0.017 8.06 2.2 0.22<br />
Table 3.1.B: Standard deviations for calculated averages <strong>of</strong> water quality parameters measured for Marsh Creek Analysis A<br />
(upstream/downstream) from five sample periods in <strong>2016</strong>.<br />
Tides Temp (<br />
℃<br />
) Field pH DO (ppm)<br />
Standard Deviation for Analysis A in <strong>2016</strong><br />
Orthophosphates<br />
Fecal<br />
Coliforms<br />
(CFU/100mL)<br />
%<br />
Transmittance Absorbance<br />
Total<br />
Phosphates<br />
(mg/L)<br />
Upstream NA 1.0 0.07 0.4 812.1 0.6 0.003 0.004 0.18 2.3 0.01<br />
Downstream NA 1.0 0.55 2.8 89364 0.8 0.004 0.006 0.59 1.6 0.05<br />
The results for fecal coliform, total suspended solids, orthophosphates, salinity, dissolved oxygen, and<br />
field pH (Table 3.1.A) were included in the historical (1993 – <strong>2016</strong>) data set for these sampling stations<br />
(Appendix G).<br />
The average fecal coliform count, including the rain event, (Figure 3.1.A) was 40142 CFU/100 mL at the<br />
downstream site and 517 CFU/100 mL at the upstream site. The downstream coliform count was higher<br />
than it has been in the last two years but is considered to be highly affected by outside factors.<br />
Lab pH<br />
TSS (mg/L)<br />
Salinity<br />
(ppt)<br />
13