Rebirth of Water Report 2016-2017
Marsh Creek, which is the largest watershed in greater Saint John, has been the recipient of centuries of untreated municipal wastewater deposition. Offensive odours, unsightly sanitary products and the threat posed by various human pathogens, resulting largely from the ~50 sewage outfalls in the lower reaches of Marsh Creek and the Saint John Harbour, have caused most residents to abandon the wellness of the watercourse. ACAP Saint John, a community-based ENGO and champion of the Harbour Cleanup project, has been conducting water quality monitoring and fish community surveys in the watershed since 1993 with the view towards someday restoring the ecological integrity of this forgotten natural asset.
Marsh Creek, which is the largest watershed in greater Saint John, has been the recipient of centuries of untreated municipal wastewater deposition. Offensive odours, unsightly sanitary products and the threat posed by various human pathogens, resulting largely from the ~50 sewage outfalls in the lower reaches of Marsh Creek and the Saint John Harbour, have caused most residents to abandon the wellness of the watercourse. ACAP Saint John, a community-based ENGO and champion of the Harbour Cleanup project, has been conducting water quality monitoring and fish community surveys in the watershed since 1993 with the view towards someday restoring the ecological integrity of this forgotten natural asset.

Create successful ePaper yourself
Turn your PDF publications into a flip-book with our unique Google optimized e-Paper software.
The TSS (Figure 3.1.B) results were 2.2 and 3.2 mg/L in the downstream and upstream site, respectively.<br />
The results are consistent with previous years where they were both found to follow the same trends; the<br />
downstream site was at the lowest recorded value and the upstream site at the highest recorded value<br />
since 2011.<br />
The orthophosphate concentration was 0.017 and 0.012 mg/L at the downstream and upstream site,<br />
respectively.<br />
Salinity (Figure 3.1 D) was 0.22 and 0.08 ppt at the downstream and upstream site, respectively.<br />
Dissolved oxygen results were 10.1 and 8.8 ppm in the downstream and upstream site, respectively. The<br />
dissolved oxygen concentration at the downstream site continues to increase as seen in recent years.<br />
100000000<br />
Fecal coliform (cfu/100 ml)<br />
10000000<br />
1000000<br />
100000<br />
10000<br />
1000<br />
100<br />
10<br />
Upstream<br />
Downstream<br />
1<br />
1994 1996 1998 2000 2002 2004 2006 2008 2010 2012 2014 <strong>2016</strong><br />
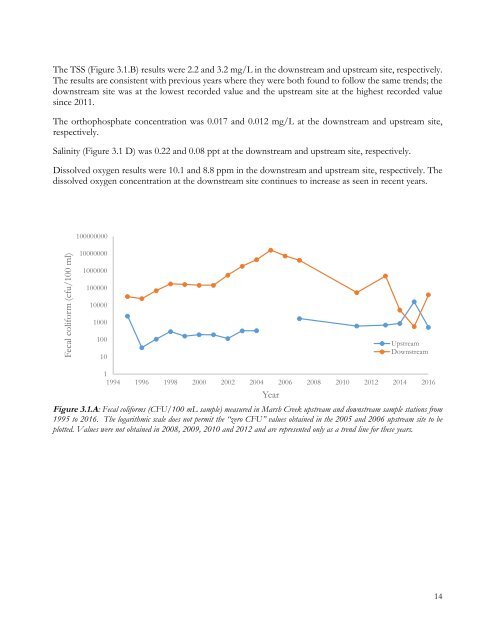
Figure 3.1.A: Fecal coliforms (CFU/100 mL sample) measured in Marsh Creek upstream and downstream sample stations from<br />
1995 to <strong>2016</strong>. The logarithmic scale does not permit the “zero CFU” values obtained in the 2005 and 2006 upstream site to be<br />
plotted. Values were not obtained in 2008, 2009, 2010 and 2012 and are represented only as a trend line for these years.<br />
Year<br />
14