Rebirth of Water Report 2016-2017
Marsh Creek, which is the largest watershed in greater Saint John, has been the recipient of centuries of untreated municipal wastewater deposition. Offensive odours, unsightly sanitary products and the threat posed by various human pathogens, resulting largely from the ~50 sewage outfalls in the lower reaches of Marsh Creek and the Saint John Harbour, have caused most residents to abandon the wellness of the watercourse. ACAP Saint John, a community-based ENGO and champion of the Harbour Cleanup project, has been conducting water quality monitoring and fish community surveys in the watershed since 1993 with the view towards someday restoring the ecological integrity of this forgotten natural asset.
Marsh Creek, which is the largest watershed in greater Saint John, has been the recipient of centuries of untreated municipal wastewater deposition. Offensive odours, unsightly sanitary products and the threat posed by various human pathogens, resulting largely from the ~50 sewage outfalls in the lower reaches of Marsh Creek and the Saint John Harbour, have caused most residents to abandon the wellness of the watercourse. ACAP Saint John, a community-based ENGO and champion of the Harbour Cleanup project, has been conducting water quality monitoring and fish community surveys in the watershed since 1993 with the view towards someday restoring the ecological integrity of this forgotten natural asset.

You also want an ePaper? Increase the reach of your titles
YUMPU automatically turns print PDFs into web optimized ePapers that Google loves.
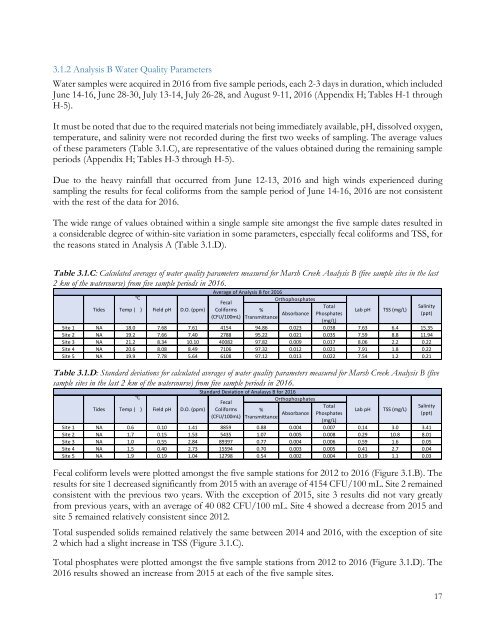
3.1.2 Analysis B <strong>Water</strong> Quality Parameters<br />
<strong>Water</strong> samples were acquired in <strong>2016</strong> from five sample periods, each 2-3 days in duration, which included<br />
June 14-16, June 28-30, July 13-14, July 26-28, and August 9-11, <strong>2016</strong> (Appendix H; Tables H-1 through<br />
H-5).<br />
It must be noted that due to the required materials not being immediately available, pH, dissolved oxygen,<br />
temperature, and salinity were not recorded during the first two weeks <strong>of</strong> sampling. The average values<br />
<strong>of</strong> these parameters (Table 3.1.C), are representative <strong>of</strong> the values obtained during the remaining sample<br />
periods (Appendix H; Tables H-3 through H-5).<br />
Due to the heavy rainfall that occurred from June 12-13, <strong>2016</strong> and high winds experienced during<br />
sampling the results for fecal coliforms from the sample period <strong>of</strong> June 14-16, <strong>2016</strong> are not consistent<br />
with the rest <strong>of</strong> the data for <strong>2016</strong>.<br />
The wide range <strong>of</strong> values obtained within a single sample site amongst the five sample dates resulted in<br />
a considerable degree <strong>of</strong> within-site variation in some parameters, especially fecal coliforms and TSS, for<br />
the reasons stated in Analysis A (Table 3.1.D).<br />
Table 3.1.C: Calculated averages <strong>of</strong> water quality parameters measured for Marsh Creek Analysis B (five sample sites in the last<br />
2 km <strong>of</strong> the watercourse) from five sample periods in <strong>2016</strong>.<br />
Tides Temp (<br />
℃<br />
) Field pH D.O. (ppm)<br />
Average <strong>of</strong> Analysis B for <strong>2016</strong><br />
Orthophosphates<br />
Fecal<br />
Coliforms<br />
(CFU/100mL)<br />
Total<br />
%<br />
Transmittance Absorbance Phosphates<br />
(mg/L)<br />
Site 1 NA 18.0 7.68 7.61 4154 94.86 0.023 0.038 7.63 6.4 15.35<br />
Site 2 NA 19.2 7.66 7.40 2788 95.22 0.021 0.035 7.59 8.8 11.94<br />
Site 3 NA 21.2 8.34 10.10 40082 97.82 0.009 0.017 8.06 2.2 0.22<br />
Site 4 NA 20.6 8.08 8.49 7106 97.32 0.012 0.021 7.91 1.8 0.22<br />
Site 5 NA 19.9 7.78 5.64 6108 97.12 0.013 0.022 7.54 1.2 0.21<br />
Table 3.1.D: Standard deviations for calculated averages <strong>of</strong> water quality parameters measured for Marsh Creek Analysis B (five<br />
sample sites in the last 2 km <strong>of</strong> the watercourse) from five sample periods in <strong>2016</strong>.<br />
Tides Temp (<br />
Standard Deviation <strong>of</strong> Analasys B for <strong>2016</strong><br />
℃<br />
Orthophosphates<br />
Fecal<br />
Total<br />
) Field pH D.O. (ppm) Coliforms %<br />
Transmittance Absorbance Phosphates<br />
(CFU/100mL)<br />
(mg/L)<br />
Fecal coliform levels were plotted amongst the five sample stations for 2012 to <strong>2016</strong> (Figure 3.1.B). The<br />
results for site 1 decreased significantly from 2015 with an average <strong>of</strong> 4154 CFU/100 mL. Site 2 remained<br />
consistent with the previous two years. With the exception <strong>of</strong> 2015, site 3 results did not vary greatly<br />
from previous years, with an average <strong>of</strong> 40 082 CFU/100 mL. Site 4 showed a decrease from 2015 and<br />
site 5 remained relatively consistent since 2012.<br />
Total suspended solids remained relatively the same between 2014 and <strong>2016</strong>, with the exception <strong>of</strong> site<br />
2 which had a slight increase in TSS (Figure 3.1.C).<br />
Total phosphates were plotted amongst the five sample stations from 2012 to <strong>2016</strong> (Figure 3.1.D). The<br />
<strong>2016</strong> results showed an increase from 2015 at each <strong>of</strong> the five sample sites.<br />
Lab pH<br />
TSS (mg/L)<br />
Site 1 NA 0.6 0.10 1.41 8859 0.88 0.004 0.007 0.14 3.0 3.41<br />
Site 2 NA 1.7 0.15 1.53 5435 1.07 0.005 0.008 0.29 10.8 8.01<br />
Site 3 NA 1.0 0.55 2.84 89397 0.77 0.004 0.006 0.59 1.6 0.05<br />
Site 4 NA 1.5 0.40 2.73 15594 0.70 0.003 0.005 0.41 2.7 0.04<br />
Site 5 NA 1.9 0.19 1.04 12798 0.54 0.002 0.004 0.19 1.1 0.03<br />
Lab pH<br />
TSS (mg/L)<br />
Salinity<br />
(ppt)<br />
Salinity<br />
(ppt)<br />
17