ASQ7 EN (20170705)

Create successful ePaper yourself
Turn your PDF publications into a flip-book with our unique Google optimized e-Paper software.
MOOD & INT<strong>EN</strong>TIONS: ASIA-PACIFIC REGION SURVEY 2017 Q2<br />
GREATER CHINA<br />
Improved Aircraft Utilization<br />
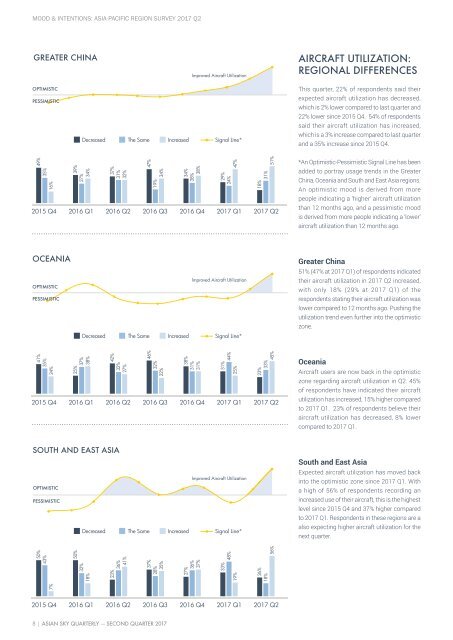
AIRCRAFT UTILIZATION:<br />
REGIONAL DIFFER<strong>EN</strong>CES<br />
OPTIMISTIC<br />
PESSIMISTIC<br />
This quarter, 22% of respondents said their<br />
expected aircraft utilization has decreased,<br />
which is 2% lower compared to last quarter and<br />
22% lower since 2015 Q4. 54% of respondents<br />
said their aircraft utilization has increased,<br />
49+0+0+0+0 35+0+0+0+027+0+0+0+032+0+0+0+0 16+0+0+034+0+0<br />
39+0+0+0+0 +0+032+0+0+034+0+0<br />
19+0+0+0+028+0+ 37+0+0+0+0 +0+038+0+0+0+0 +0+0+0+0 47+0+0+0+0 24+0+0+0+0 29+0+0+0+0 51 3431<br />
18<br />
which is a 3% increase compared to last quarter<br />
Decreased The Same Increased Signal Line*<br />
and a 35% increase since 2015 Q4.<br />
*An Optimistic-Pessimistic Signal Line has been<br />
added to portray usage trends in the Greater<br />
China, Oceania and South and East Asia regions.<br />
An optimistic mood is derived from more<br />
people indicating a ‘higher’ aircraft utilization<br />
2015 Q4 2016 Q1 2016 Q2 2016 Q3 2016 Q4 2017 Q1 2017 Q2<br />
than 12 months ago, and a pessimistic mood<br />
is derived from more people indicating a ‘lower’<br />
49%<br />
35%<br />
16%<br />
39%<br />
27%<br />
34%<br />
37%<br />
31%<br />
32%<br />
47%<br />
19%<br />
34%<br />
34%<br />
28%<br />
38%<br />
29%<br />
24%<br />
47%<br />
18%<br />
31%<br />
51%<br />
aircraft utilization than 12 months ago.<br />
OCEANIA<br />
Greater China<br />
51% (47% at 2017 Q1) of respondents indicated<br />
Improved Aircraft Utilization<br />
their aircraft utilization in 2017 Q2 increased,<br />
OPTIMISTIC<br />
PESSIMISTIC<br />
with only 18% (29% at 2017 Q1) of the<br />
respondents stating their aircraft utilization was<br />
lower compared to 12 months ago. Pushing the<br />
utilization trend even further into the optimistic<br />
41+0+0+0+0 35+0+0+0+037+0+0+0+030+0+0+0+0 24+0+0+038+0+0<br />
25+0+0+0+0 +0+027+0+0+022+0+0<br />
32+0+0+0+031+0+ 42+0+0+0+0 +0+031+0+0+0+0 +0+0+0+0 46+0+0+0+0 44+0+0+0+0 25+0+0+0+0 31+0+0+0+0 45 3833<br />
23<br />
zone.<br />
Decreased The Same Increased Signal Line*<br />
Oceania<br />
Aircraft users are now back in the optimistic<br />
zone regarding aircraft utilization in Q2. 45%<br />
of respondents have indicated their aircraft<br />
2015 Q4 2016 Q1 2016 Q2 2016 Q3 2016 Q4 2017 Q1 2017 Q2<br />
utilization has increased, 15% higher compared<br />
to 2017 Q1. 23% of respondents believe their<br />
41%<br />
35%<br />
24%<br />
25%<br />
37%<br />
38%<br />
42%<br />
32%<br />
27%<br />
46%<br />
32%<br />
22%<br />
38%<br />
31%<br />
31%<br />
31%<br />
44%<br />
25%<br />
23%<br />
33%<br />
45%<br />
aircraft utilization has decreased, 8% lower<br />
compared to 2017 Q1.<br />
SOUTH AND EAST ASIA<br />
South and East Asia<br />
Expected aircraft utilization has moved back<br />
Improved Aircraft Utilization<br />
into the optimistic zone since 2017 Q1. With<br />
OPTIMISTIC<br />
PESSIMISTIC<br />
a high of 56% of respondents recording an<br />
increased use of their aircraft, this is the highest<br />
level since 2015 Q4 and 37% higher compared<br />
to 2017 Q1. Respondents in these regions are a<br />
50+0+0+0+0 43+0+0+0+032+0+0+0+036+0+0+0+0 7+0+0+018+0+0<br />
50+0+0+0+0 +0+041+0+0+035+0+0<br />
28+0+0+0+036+0+ 23+0+0+0+0 +0+037+0+0+0+0 +0+0+0+0 37+0+0+0+0 48+0+0+0+0 19+0+0+0+0 33+0+0+0+0 56 2718<br />
26<br />
also expecting higher aircraft utilization for the<br />
Decreased The Same Increased Signal Line*<br />
next quarter.<br />
2015 Q4 2016 Q1 2016 Q2 2016 Q3 2016 Q4 2017 Q1 2017 Q2<br />
50%<br />
43%<br />
7%<br />
50%<br />
32%<br />
18%<br />
23%<br />
36%<br />
41%<br />
37%<br />
28%<br />
35%<br />
27%<br />
36%<br />
37%<br />
33%<br />
48%<br />
19%<br />
26%<br />
18%<br />
56%<br />
8 | ASIAN SKY QUARTERLY — SECOND QUARTER 2017