ASQ7 EN (20170705)

Create successful ePaper yourself
Turn your PDF publications into a flip-book with our unique Google optimized e-Paper software.
MARKET DYNAMICS<br />
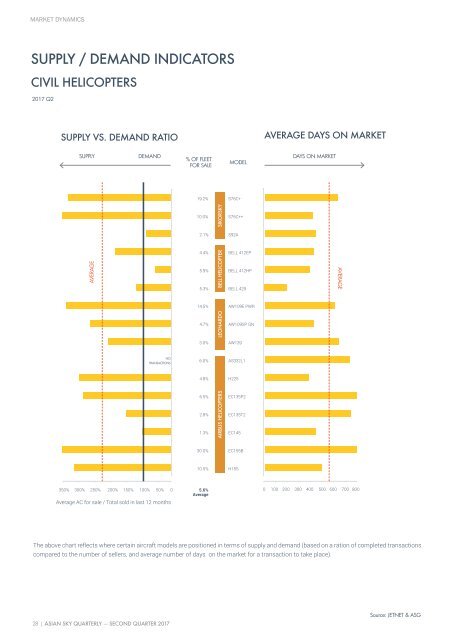
SUPPLY / DEMAND INDICATORS<br />
CIVIL HELICOPTERS<br />
2017 Q2<br />
SUPPLY VS. DEMAND RATIO<br />
AVERAGE DAYS ON MARKET<br />
SUPPLY<br />
DEMAND<br />
% OF FLEET<br />
FOR SALE<br />
MODEL<br />
DAYS ON MARKET<br />
19.2%<br />
S76C+<br />
10.0%<br />
SIKORSKY<br />
S76C++<br />
2.1%<br />
S92A<br />
AVERAGE<br />
4.4%<br />
5.9%<br />
5.3%<br />
BELL HELICOPTER<br />
BELL 412EP<br />
BELL 412HP<br />
BELL 429<br />
AVERAGE<br />
14.5%<br />
AW109E PWR<br />
4.7%<br />
LEONARDO<br />
AW109SP GN<br />
3.0%<br />
AW139<br />
NO<br />
TRANSACTIONS<br />
6.0%<br />
AS332L1<br />
4.8%<br />
H225<br />
6.5%<br />
2.8%<br />
1.3%<br />
AIRBUS HELICOPTERS<br />
EC135P2<br />
EC135T2<br />
EC145<br />
30.0%<br />
EC155B<br />
10.5%<br />
H155<br />
350% 300% 250% 200% 150% 100% 50% 0<br />
Average AC for sale / Total sold in last 12 months<br />
5.6%<br />
Average<br />
0 100 200 300 400 500 600 700 800<br />
The above chart reflects where certain aircraft models are positioned in terms of supply and demand (based on a ration of completed transactions<br />
compared to the number of sellers, and average number of days on the market for a transaction to take place).<br />
28 | ASIAN SKY QUARTERLY — SECOND QUARTER 2017<br />
Source: JETNET & ASG