ASQ7 EN (20170705)

Create successful ePaper yourself
Turn your PDF publications into a flip-book with our unique Google optimized e-Paper software.
MARKET DYNAMICS<br />
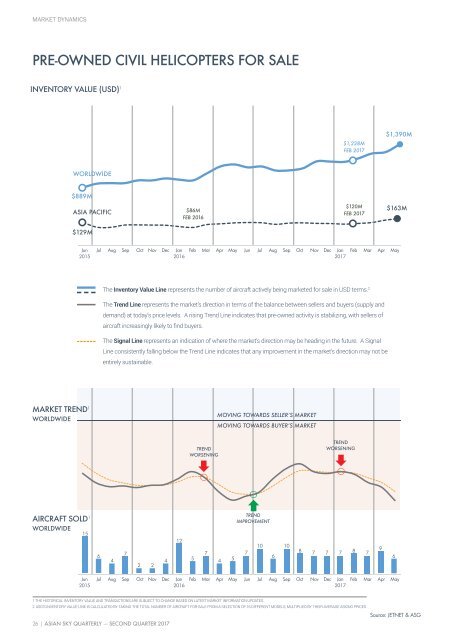
PRE-OWNED CIVIL HELICOPTERS FOR SALE<br />
INV<strong>EN</strong>TORY VALUE (USD) 1<br />
$1,228M<br />
FEB 2017<br />
$1,390M<br />
WORLDWIDE<br />
$889M<br />
ASIA PACIFIC<br />
$86M<br />
FEB 2016<br />
$120M<br />
FEB 2017<br />
$163M<br />
$129M<br />
Jun<br />
2015<br />
Jul<br />
Aug<br />
Sep<br />
Oct<br />
Nov<br />
Dec<br />
Jan<br />
2016<br />
Feb<br />
Mar<br />
Apr<br />
May<br />
Jun<br />
Jul<br />
Aug<br />
Sep<br />
Oct<br />
Nov<br />
Dec<br />
Jan<br />
2017<br />
Feb<br />
Mar<br />
Apr<br />
May<br />
The Inventory Value Line represents the number of aircraft actively being marketed for sale in USD terms. 2<br />
The Trend Line represents the market’s direction in terms of the balance between sellers and buyers (supply and<br />
demand) at today’s price levels. A rising Trend Line indicates that pre-owned activity is stabilizing, with sellers of<br />
aircraft increasingly likely to find buyers.<br />
The Signal Line represents an indication of where the market’s direction may be heading in the future. A Signal<br />
Line consistently falling below the Trend Line indicates that any improvement in the market’s direction may not be<br />
entirely sustainable.<br />
MARKET TR<strong>EN</strong>D 1<br />
WORLDWIDE<br />
MOVING TOWARDS SELLER’S MARKET<br />
MOVING TOWARDS BUYER’S MARKET<br />
TR<strong>EN</strong>D<br />
WORS<strong>EN</strong>ING<br />
TR<strong>EN</strong>D<br />
WORS<strong>EN</strong>ING<br />
AIRCRAFT SOLD 1<br />
WORLDWIDE<br />
15<br />
6<br />
4<br />
7<br />
2 2<br />
4<br />
12<br />
5<br />
7<br />
4<br />
5<br />
TR<strong>EN</strong>D<br />
IMPROVEM<strong>EN</strong>T<br />
7<br />
10<br />
10<br />
8 7 7 7 8<br />
9<br />
7<br />
6 6<br />
Jun<br />
2015<br />
Jul<br />
Aug<br />
Sep<br />
Oct<br />
Nov<br />
Dec<br />
Jan<br />
2016<br />
Feb<br />
Mar<br />
Apr<br />
May<br />
Jun<br />
Jul<br />
Aug<br />
Sep<br />
Oct<br />
Nov<br />
Dec<br />
Jan<br />
2017<br />
Feb<br />
Mar<br />
Apr<br />
May<br />
1 THE HISTORICAL INV<strong>EN</strong>TORY VALUE AND TRANSACTIONS ARE SUBJECT TO CHANGE BASED ON LATEST MARKET INFORMATION UPDATES.<br />
2 ASG’S INV<strong>EN</strong>TORY VALUE LINE IS CALCULATED BY TAKING THE TOTAL NUMBER OF AIRCRAFT FOR SALE FROM A SELECTION OF 16 DIFFER<strong>EN</strong>T MODELS, MULTIPLIED BY THEIR AVERAGE ASKING PRICES.<br />
26 | ASIAN SKY QUARTERLY — SECOND QUARTER 2017<br />
Source: JETNET & ASG