

Northampton General Hospital NHS Trust Quality Account 2016-2017
Northampton General Hospital NHS Trust Quality account 2016-2017
Northampton General Hospital NHS Trust Quality account 2016-2017

You also want an ePaper? Increase the reach of your titles
YUMPU automatically turns print PDFs into web optimized ePapers that Google loves.
The results show that the trust is below the national average for the level of harm. NGH has taken<br />
the following action to improve the percentages and rates, and so the quality of its services by<br />
further encouraging an open reporting culture. This is being done through regular engagement with<br />
staff via newsletters, through learning events such as Dare to Share and regular attendance at<br />
ward and department meetings.<br />
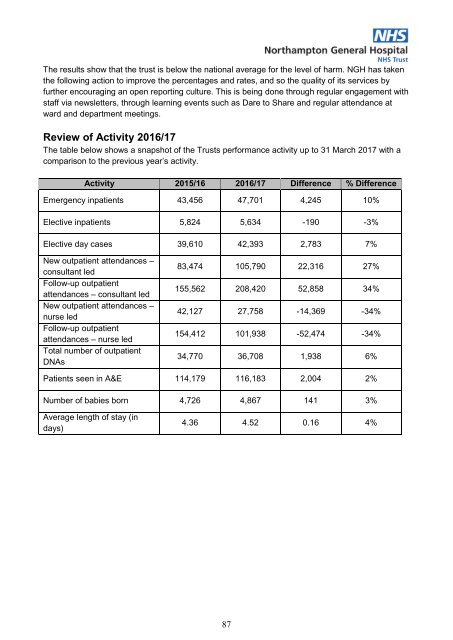
Review of Activity <strong>2016</strong>/17<br />
The table below shows a snapshot of the <strong>Trust</strong>s performance activity up to 31 March <strong>2017</strong> with a<br />
comparison to the previous year’s activity.<br />
Activity 2015/16 <strong>2016</strong>/17 Difference % Difference<br />
Emergency inpatients 43,456 47,701 4,245 10%<br />
Elective inpatients 5,824 5,634 -190 -3%<br />
Elective day cases 39,610 42,393 2,783 7%<br />
New outpatient attendances –<br />
consultant led<br />
Follow-up outpatient<br />
attendances – consultant led<br />
New outpatient attendances –<br />
nurse led<br />
Follow-up outpatient<br />
attendances – nurse led<br />
Total number of outpatient<br />
DNAs<br />
83,474 105,790 22,316 27%<br />
155,562 208,420 52,858 34%<br />
42,127 27,758 -14,369 -34%<br />
154,412 101,938 -52,474 -34%<br />
34,770 36,708 1,938 6%<br />
Patients seen in A&E 114,179 116,183 2,004 2%<br />
Number of babies born 4,726 4,867 141 3%<br />
Average length of stay (in<br />
days)<br />
4.36 4.52 0.16 4%<br />
87