lna 2007 profiles Y rev1.qxp - Advertising Age
lna 2007 profiles Y rev1.qxp - Advertising Age
lna 2007 profiles Y rev1.qxp - Advertising Age

Create successful ePaper yourself
Turn your PDF publications into a flip-book with our unique Google optimized e-Paper software.
4 | <strong>Advertising</strong> <strong>Age</strong> | June 25, <strong>2007</strong><br />
DATACENTER 100 LEADING NATIONAL ADVERTISERS: MARKETER PROFILES YEARBOOK<br />
TOP 100 SPENDING UP<br />
3.1% TO $105 BILLION<br />
BIG SHIFT: Traditional media feel the pinch as No.1 P&G and<br />
other marketers extend their reach via internet,promotions<br />
By BRADLEY JOHNSON<br />
bjohnson@adage.com<br />
the top 100 U.S. advertisers last year<br />
increased ad spending by a modest 3.1% to a<br />
record $104.8 billion. But most of that<br />
growth came from “unmeasured” disciplines.<br />
In a troubling sign for traditional<br />
media, the marketing leaders increased<br />
measured media spending by just 0.6%, the<br />
smallest gain since the 2001 recession.<br />
Media measured by ad-tracking services—such<br />
as TV, print and some forms of<br />
internet advertising—accounted for 58.2%<br />
of these top marketers’ U.S. ad spending,<br />
down from 59.6% in 2005, according to<br />
<strong>Advertising</strong> <strong>Age</strong>’s 52nd annual 100 Leading<br />
National Advertisers report.<br />
The rest of the spending came from<br />
unmeasured disciplines, primarily marketing<br />
services such as direct marketing, sales promotion<br />
and digital communications (including<br />
unmeasured forms of internet media<br />
such as paid search).<br />
Exhibit A: Procter & Gamble Co., the No.<br />
1 advertiser. Ad <strong>Age</strong> estimates that P&G’s<br />
unmeasured U.S. spending last year rose<br />
15% vs. a 3.9% increase in measured media.<br />
The package-goods giant’s shift toward<br />
unmeasured disciplines continues. The marketer’s<br />
first-quarter measured spending fell<br />
8.6%, according to TNS Media Intelligence.<br />
P&G Chairman-CEO A.G. Lafley Jr. last<br />
month told analysts: “If you step back and<br />
look at our [marketing] mix across most of<br />
the major brands, it’s clearly shifting, and it’s<br />
shifting from measured media to in-store, to<br />
the internet and to trial activity [i.e., product<br />
sampling].” Mr. Lafley said P&G will put a<br />
big emphasis on such “nonmeasured media”<br />
in the fiscal year beginning July 1.<br />
The shift from measured media mirrors<br />
what’s happening in the agency business.<br />
Since 2005, U.S. marketing-communications<br />
agencies have generated more revenue from<br />
marketing services than from traditional<br />
advertising and media, according to Ad <strong>Age</strong>’s<br />
DataCenter (AA, June 11). Omnicom Group,<br />
the world’s largest marketing organization,<br />
generated 57% of its revenue last quarter<br />
from marketing services.<br />
MAJORITY BOOST SPENDING<br />
Sixty-nine of the 100 marketers disclosed<br />
worldwide ad spending in their annual<br />
reports. They define “advertising” differently—some<br />
include only media spending, while<br />
others factor in promotion—but the figures<br />
provide a useful indicator of global spending<br />
trends. Among these companies, stated<br />
worldwide ad spending last year increased<br />
3.5%, and revenue increased 7.3%.<br />
As for U.S. advertising, 69 of the 100<br />
LNA companies increased combined measured/unmeasured<br />
U.S. ad spending last year;<br />
75 of the 100 increased measured media<br />
spending.<br />
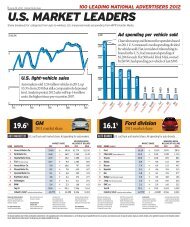
On Ad <strong>Age</strong>’s list, the biggest cut in U.S.<br />
spending came at General Motors Corp.,<br />
down a whopping $814 million or 19.8%.<br />
GM reduced spending for each of its brands,<br />
but its big spending cut reflected a pullback in<br />
corporate advertising.<br />
GM’s ad cuts moved the automaker down<br />
a notch to third place in the LNA ranking.<br />
AT&T grabbed the No. 2 slot as its estimated<br />
spending jumped 26% to about $3.3 billion.<br />
The company spent heavily to rebrand<br />
SBC as AT&T.<br />
The top advertiser is no surprise: Procter<br />
& Gamble, whose estimated spending last<br />
year rose 6.8% to $4.9 billion. P&G has been<br />
No. 1 or No. 2 for 50 of the 52 years that Ad<br />
<strong>Age</strong> has ranked Leading National<br />
Advertisers. P&G, following its 2005 Gillette<br />
acquisition, now appears to have a lock on<br />
No. 1; its ’06 estimated spending was 46%<br />
higher than that of No. 2 AT&T.<br />
The nation’s top 100 advertisers last year<br />
accounted for 41% of U.S. measured spending.Their<br />
share varies by medium:The companies<br />
accounted for 67% of network TV<br />
advertising but only 34% of measured internet<br />
advertising.<br />
The marketing leaders drive some ad categories.<br />
Measured spending in the biggest ad<br />
category, automotive, fell 5.7% or $1.2 billion,<br />
reflecting a pullback in Detroit.<br />
Telecom, the No. 3 category, rose 9.6% or<br />
$959 million. Last year’s three most-advertised<br />
brands were all telecoms:<br />
AT&T/Cingular, Verizon and Sprint.<br />
This year will be tougher. In the first<br />
quarter, six of the top 10 U.S. advertisers cut<br />
spending, according to TNS. This month,<br />
TNS cut its full-year U.S. ad growth forecast<br />
from 2.6% to 1.7%, the worst since 2001.<br />
That’s bad news for traditional media. But<br />
there should be more opportunities for disciplines<br />
unmeasured by ad trackers. Just ask<br />
P&G.