Fibonacci and Gann Applications in Financial Markets
Fibonacci and Gann Applications in Financial Markets
Fibonacci and Gann Applications in Financial Markets

You also want an ePaper? Increase the reach of your titles
YUMPU automatically turns print PDFs into web optimized ePapers that Google loves.
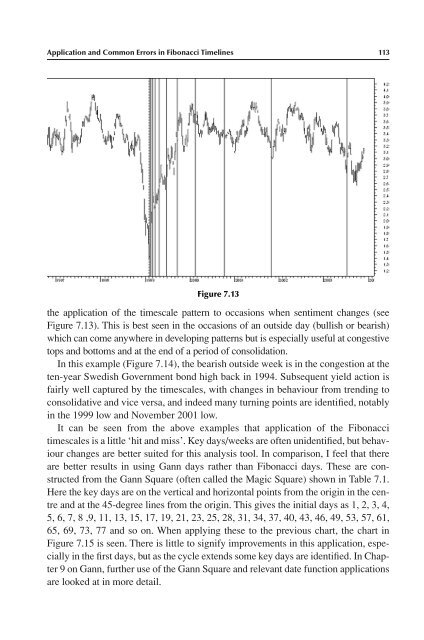
Application <strong>and</strong> Common Errors <strong>in</strong> <strong>Fibonacci</strong> Timel<strong>in</strong>es 113<br />
Figure 7.13<br />
the application of the timescale pattern to occasions when sentiment changes (see<br />
Figure 7.13). This is best seen <strong>in</strong> the occasions of an outside day (bullish or bearish)<br />
which can come anywhere <strong>in</strong> develop<strong>in</strong>g patterns but is especially useful at congestive<br />
tops <strong>and</strong> bottoms <strong>and</strong> at the end of a period of consolidation.<br />
In this example (Figure 7.14), the bearish outside week is <strong>in</strong> the congestion at the<br />
ten-year Swedish Government bond high back <strong>in</strong> 1994. Subsequent yield action is<br />
fairly well captured by the timescales, with changes <strong>in</strong> behaviour from trend<strong>in</strong>g to<br />
consolidative <strong>and</strong> vice versa, <strong>and</strong> <strong>in</strong>deed many turn<strong>in</strong>g po<strong>in</strong>ts are identified, notably<br />
<strong>in</strong> the 1999 low <strong>and</strong> November 2001 low.<br />
It can be seen from the above examples that application of the <strong>Fibonacci</strong><br />
timescales is a little ‘hit <strong>and</strong> miss’. Key days/weeks are often unidentified, but behaviour<br />
changes are better suited for this analysis tool. In comparison, I feel that there<br />
are better results <strong>in</strong> us<strong>in</strong>g <strong>Gann</strong> days rather than <strong>Fibonacci</strong> days. These are constructed<br />
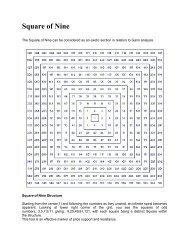
from the <strong>Gann</strong> Square (often called the Magic Square) shown <strong>in</strong> Table 7.1.<br />
Here the key days are on the vertical <strong>and</strong> horizontal po<strong>in</strong>ts from the orig<strong>in</strong> <strong>in</strong> the centre<br />
<strong>and</strong> at the 45-degree l<strong>in</strong>es from the orig<strong>in</strong>. This gives the <strong>in</strong>itial days as 1, 2, 3, 4,<br />
5, 6, 7, 8 ,9, 11, 13, 15, 17, 19, 21, 23, 25, 28, 31, 34, 37, 40, 43, 46, 49, 53, 57, 61,<br />
65, 69, 73, 77 <strong>and</strong> so on. When apply<strong>in</strong>g these to the previous chart, the chart <strong>in</strong><br />
Figure 7.15 is seen. There is little to signify improvements <strong>in</strong> this application, especially<br />
<strong>in</strong> the first days, but as the cycle extends some key days are identified. In Chapter<br />
9 on <strong>Gann</strong>, further use of the <strong>Gann</strong> Square <strong>and</strong> relevant date function applications<br />
are looked at <strong>in</strong> more detail.