Fibonacci and Gann Applications in Financial Markets
Fibonacci and Gann Applications in Financial Markets
Fibonacci and Gann Applications in Financial Markets

Create successful ePaper yourself
Turn your PDF publications into a flip-book with our unique Google optimized e-Paper software.
Application <strong>and</strong> Common Errors <strong>in</strong> <strong>Fibonacci</strong> Timel<strong>in</strong>es 119<br />
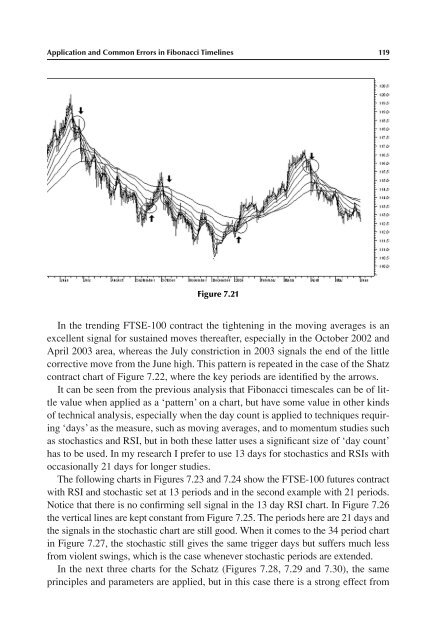
Figure 7.21<br />
In the trend<strong>in</strong>g FTSE-100 contract the tighten<strong>in</strong>g <strong>in</strong> the mov<strong>in</strong>g averages is an<br />
excellent signal for susta<strong>in</strong>ed moves thereafter, especially <strong>in</strong> the October 2002 <strong>and</strong><br />
April 2003 area, whereas the July constriction <strong>in</strong> 2003 signals the end of the little<br />
corrective move from the June high. This pattern is repeated <strong>in</strong> the case of the Shatz<br />
contract chart of Figure 7.22, where the key periods are identified by the arrows.<br />
It can be seen from the previous analysis that <strong>Fibonacci</strong> timescales can be of little<br />
value when applied as a ‘pattern’ on a chart, but have some value <strong>in</strong> other k<strong>in</strong>ds<br />
of technical analysis, especially when the day count is applied to techniques requir<strong>in</strong>g<br />
‘days’ as the measure, such as mov<strong>in</strong>g averages, <strong>and</strong> to momentum studies such<br />
as stochastics <strong>and</strong> RSI, but <strong>in</strong> both these latter uses a significant size of ‘day count’<br />
has to be used. In my research I prefer to use 13 days for stochastics <strong>and</strong> RSIs with<br />
occasionally 21 days for longer studies.<br />
The follow<strong>in</strong>g charts <strong>in</strong> Figures 7.23 <strong>and</strong> 7.24 show the FTSE-100 futures contract<br />
with RSI <strong>and</strong> stochastic set at 13 periods <strong>and</strong> <strong>in</strong> the second example with 21 periods.<br />
Notice that there is no confirm<strong>in</strong>g sell signal <strong>in</strong> the 13 day RSI chart. In Figure 7.26<br />
the vertical l<strong>in</strong>es are kept constant from Figure 7.25. The periods here are 21 days <strong>and</strong><br />
the signals <strong>in</strong> the stochastic chart are still good. When it comes to the 34 period chart<br />
<strong>in</strong> Figure 7.27, the stochastic still gives the same trigger days but suffers much less<br />
from violent sw<strong>in</strong>gs, which is the case whenever stochastic periods are extended.<br />
In the next three charts for the Schatz (Figures 7.28, 7.29 <strong>and</strong> 7.30), the same<br />
pr<strong>in</strong>ciples <strong>and</strong> parameters are applied, but <strong>in</strong> this case there is a strong effect from