Fibonacci and Gann Applications in Financial Markets
Fibonacci and Gann Applications in Financial Markets
Fibonacci and Gann Applications in Financial Markets

Create successful ePaper yourself
Turn your PDF publications into a flip-book with our unique Google optimized e-Paper software.
Other Interest<strong>in</strong>g Studies Us<strong>in</strong>g Synthetic Ratios 189<br />
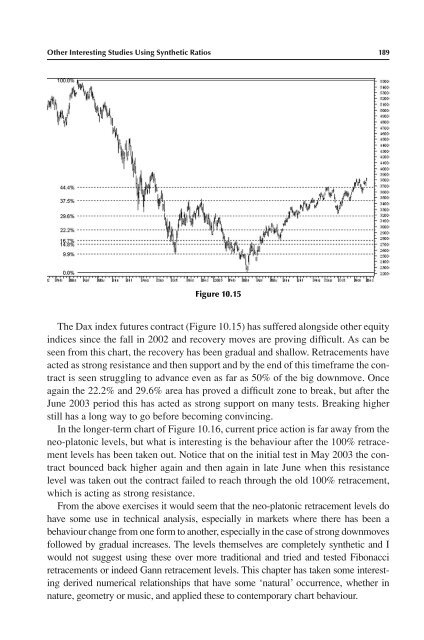
Figure 10.15<br />
The Dax <strong>in</strong>dex futures contract (Figure 10.15) has suffered alongside other equity<br />
<strong>in</strong>dices s<strong>in</strong>ce the fall <strong>in</strong> 2002 <strong>and</strong> recovery moves are prov<strong>in</strong>g difficult. As can be<br />
seen from this chart, the recovery has been gradual <strong>and</strong> shallow. Retracements have<br />
acted as strong resistance <strong>and</strong> then support <strong>and</strong> by the end of this timeframe the contract<br />
is seen struggl<strong>in</strong>g to advance even as far as 50% of the big downmove. Once<br />
aga<strong>in</strong> the 22.2% <strong>and</strong> 29.6% area has proved a difficult zone to break, but after the<br />
June 2003 period this has acted as strong support on many tests. Break<strong>in</strong>g higher<br />
still has a long way to go before becom<strong>in</strong>g conv<strong>in</strong>c<strong>in</strong>g.<br />
In the longer-term chart of Figure 10.16, current price action is far away from the<br />
neo-platonic levels, but what is <strong>in</strong>terest<strong>in</strong>g is the behaviour after the 100% retracement<br />
levels has been taken out. Notice that on the <strong>in</strong>itial test <strong>in</strong> May 2003 the contract<br />
bounced back higher aga<strong>in</strong> <strong>and</strong> then aga<strong>in</strong> <strong>in</strong> late June when this resistance<br />
level was taken out the contract failed to reach through the old 100% retracement,<br />
which is act<strong>in</strong>g as strong resistance.<br />
From the above exercises it would seem that the neo-platonic retracement levels do<br />
have some use <strong>in</strong> technical analysis, especially <strong>in</strong> markets where there has been a<br />
behaviour change from one form to another, especially <strong>in</strong> the case of strong downmoves<br />
followed by gradual <strong>in</strong>creases. The levels themselves are completely synthetic <strong>and</strong> I<br />
would not suggest us<strong>in</strong>g these over more traditional <strong>and</strong> tried <strong>and</strong> tested <strong>Fibonacci</strong><br />
retracements or <strong>in</strong>deed <strong>Gann</strong> retracement levels. This chapter has taken some <strong>in</strong>terest<strong>in</strong>g<br />
derived numerical relationships that have some ‘natural’ occurrence, whether <strong>in</strong><br />
nature, geometry or music, <strong>and</strong> applied these to contemporary chart behaviour.