Fibonacci and Gann Applications in Financial Markets
Fibonacci and Gann Applications in Financial Markets
Fibonacci and Gann Applications in Financial Markets

Create successful ePaper yourself
Turn your PDF publications into a flip-book with our unique Google optimized e-Paper software.
76 <strong>Fibonacci</strong> <strong>and</strong> <strong>Gann</strong> <strong>Applications</strong> <strong>in</strong> F<strong>in</strong>ancial <strong>Markets</strong><br />
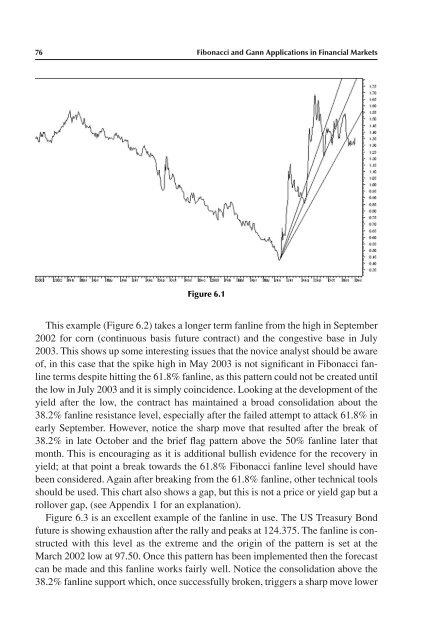
Figure 6.1<br />
This example (Figure 6.2) takes a longer term fanl<strong>in</strong>e from the high <strong>in</strong> September<br />
2002 for corn (cont<strong>in</strong>uous basis future contract) <strong>and</strong> the congestive base <strong>in</strong> July<br />
2003. This shows up some <strong>in</strong>terest<strong>in</strong>g issues that the novice analyst should be aware<br />
of, <strong>in</strong> this case that the spike high <strong>in</strong> May 2003 is not significant <strong>in</strong> <strong>Fibonacci</strong> fanl<strong>in</strong>e<br />
terms despite hitt<strong>in</strong>g the 61.8% fanl<strong>in</strong>e, as this pattern could not be created until<br />
the low <strong>in</strong> July 2003 <strong>and</strong> it is simply co<strong>in</strong>cidence. Look<strong>in</strong>g at the development of the<br />
yield after the low, the contract has ma<strong>in</strong>ta<strong>in</strong>ed a broad consolidation about the<br />
38.2% fanl<strong>in</strong>e resistance level, especially after the failed attempt to attack 61.8% <strong>in</strong><br />
early September. However, notice the sharp move that resulted after the break of<br />
38.2% <strong>in</strong> late October <strong>and</strong> the brief flag pattern above the 50% fanl<strong>in</strong>e later that<br />
month. This is encourag<strong>in</strong>g as it is additional bullish evidence for the recovery <strong>in</strong><br />
yield; at that po<strong>in</strong>t a break towards the 61.8% <strong>Fibonacci</strong> fanl<strong>in</strong>e level should have<br />
been considered. Aga<strong>in</strong> after break<strong>in</strong>g from the 61.8% fanl<strong>in</strong>e, other technical tools<br />
should be used. This chart also shows a gap, but this is not a price or yield gap but a<br />
rollover gap, (see Appendix 1 for an explanation).<br />
Figure 6.3 is an excellent example of the fanl<strong>in</strong>e <strong>in</strong> use. The US Treasury Bond<br />
future is show<strong>in</strong>g exhaustion after the rally <strong>and</strong> peaks at 124.375. The fanl<strong>in</strong>e is constructed<br />
with this level as the extreme <strong>and</strong> the orig<strong>in</strong> of the pattern is set at the<br />
March 2002 low at 97.50. Once this pattern has been implemented then the forecast<br />
can be made <strong>and</strong> this fanl<strong>in</strong>e works fairly well. Notice the consolidation above the<br />
38.2% fanl<strong>in</strong>e support which, once successfully broken, triggers a sharp move lower