Fibonacci and Gann Applications in Financial Markets
Fibonacci and Gann Applications in Financial Markets
Fibonacci and Gann Applications in Financial Markets

You also want an ePaper? Increase the reach of your titles
YUMPU automatically turns print PDFs into web optimized ePapers that Google loves.
70 <strong>Fibonacci</strong> <strong>and</strong> <strong>Gann</strong> <strong>Applications</strong> <strong>in</strong> F<strong>in</strong>ancial <strong>Markets</strong><br />
In this example, the yield <strong>in</strong> the Swiss 10Y bond recovery looks to be runn<strong>in</strong>g out<br />
of steam. The yield is struggl<strong>in</strong>g aga<strong>in</strong>st the congestion at the 50% retracement level<br />
<strong>and</strong> has not been conv<strong>in</strong>c<strong>in</strong>g <strong>in</strong> the past <strong>in</strong> show<strong>in</strong>g that a break is go<strong>in</strong>g to succeed.<br />
Trendl<strong>in</strong>e support which could be part of a wedge formation if there is further failure<br />
on the upside is keep<strong>in</strong>g the yield well supported, but there is little room for<br />
manoeuvre unless there is a successful break higher. The yield will have to move<br />
aga<strong>in</strong>st the congestion above 50% <strong>and</strong> prove that the rally is not over. It is <strong>in</strong>terest<strong>in</strong>g<br />
to note that <strong>in</strong> September 2002 a small congestion developed about 2.80/2.84%<br />
<strong>and</strong> aga<strong>in</strong> <strong>in</strong> the mid-October period. There is grow<strong>in</strong>g evidence that this is a key<br />
problem area for the yield. If there is no successful break higher then the yield will<br />
move lower aga<strong>in</strong> quickly. This is one of the problems with <strong>Fibonacci</strong> retracement<br />
levels: failure to move through retracement levels is usually caused by other technical<br />
reasons, congestion <strong>in</strong> the ma<strong>in</strong>. This chart also demonstrates that a successful<br />
move through various retracement levels is best seen when there is a succession of<br />
bull flags. There are none apparent on this chart <strong>and</strong> that is one of the issues around<br />
a successful break <strong>in</strong> the 50% level. This is <strong>in</strong> sharp contrast to the cocoa cont<strong>in</strong>uous<br />
chart seen <strong>in</strong> the next example.<br />
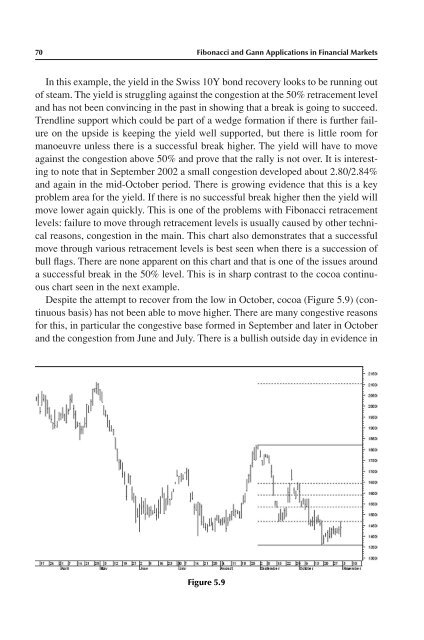
Despite the attempt to recover from the low <strong>in</strong> October, cocoa (Figure 5.9) (cont<strong>in</strong>uous<br />
basis) has not been able to move higher. There are many congestive reasons<br />
for this, <strong>in</strong> particular the congestive base formed <strong>in</strong> September <strong>and</strong> later <strong>in</strong> October<br />
<strong>and</strong> the congestion from June <strong>and</strong> July. There is a bullish outside day <strong>in</strong> evidence <strong>in</strong><br />
Figure 5.9